
Planned vs. Actual Report helps you compare the originally estimated time (planned) with the actual time spent on tasks.
Report Overview
Here’s a detailed explanation of how it works:
-
Time Comparison: The report compares:
-
Planned Time: The original time estimated to complete a task, issue, epic, or project.
-
Actual Time: The actual time spent on the task, along with any remaining time if the task is not yet completed.
-
Deviation Analysis:
-
The report calculates the deviation between the planned time and the actual time, showing both in hours and percentages.
-
Deviation %: Indicates whether the task was underestimated, overestimated, or remains on track, based on the acceptable deviation set in the report.
-
Status Indicator: Based on the deviation, the report provides a status:
-
On Track: If the actual time aligns with the original estimate, within the allowed deviation.
-
Underestimated: If more time is spent than originally estimated.
-
Overestimated: If less time is spent than planned (though this is not reflected in the current report, it can be tracked).
-
Level of Detail: This report can be generated at various levels:
-
Issue: Focuses on individual issues or tasks, breaking down time spent at the task level.
-
Project: Aggregates data at the project level, showing time comparison across all tasks within the selected project.
-
Epic: Provides insights into how epics, which can span multiple tasks and stories, performed against their original time estimates.
-
Jira Custom field: Group issues based on your Jira custom fields for more detailed analysis.
-
Customizable Filters: You can filter the report by:
-
Teams: Allows you to select specific teams or individuals.
-
Period: Choose a specific date range for which the report should be generated.
-
Project Filters: Narrow down the report to specific projects, epics, or tasks.
-
Jira Filter: Add Jira filters to refine the tasks or issues included in the report.
-
Sub-task Handling: The option to Include Time of Sub-tasks into the Parent Tasks ensures that the report captures the full scope of work, including any time spent on sub-tasks, and rolls it up into the parent task’s time calculations.
This report is highly beneficial for monitoring project performance, tracking team efficiency, and identifying tasks or projects that were underestimated or overestimated, helping to refine future planning and estimation processes of JIRA tickets, time estimates (original and remaining), time spent already on the tickets, and ticket status.
Report Generation
-
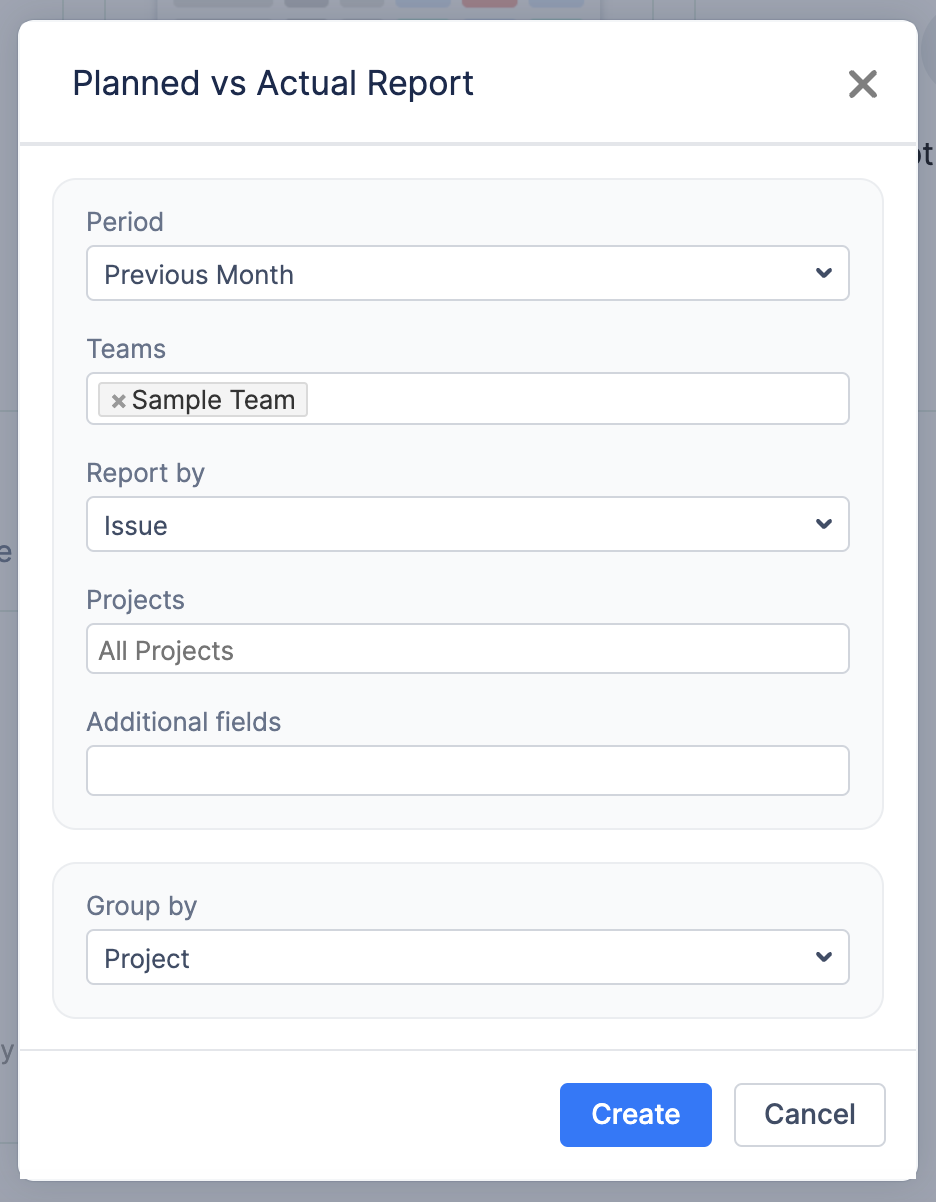
Selecting the Reporting Criteria
To generate a report, configure the following parameters:
-
Period: Choose the time frame for the report from a predefined list (e.g., Previous Month etc.).
-
Teams: Select the team for whom the report should be generated.
-
Report By: Defines the data source of the report. By default, the report includes all scheduled activities for the selected user or team, but you can filter the data further.
-
Projects: If “Project” or “Issue” is selected in the “Report By” field, specify whether the report should include all projects or only a selected one.
-
Additional Fields: When Info by is set to Issue, Epic or Jira filter, you can extend this report by adding information from Jira custom fields directly to the report.
-
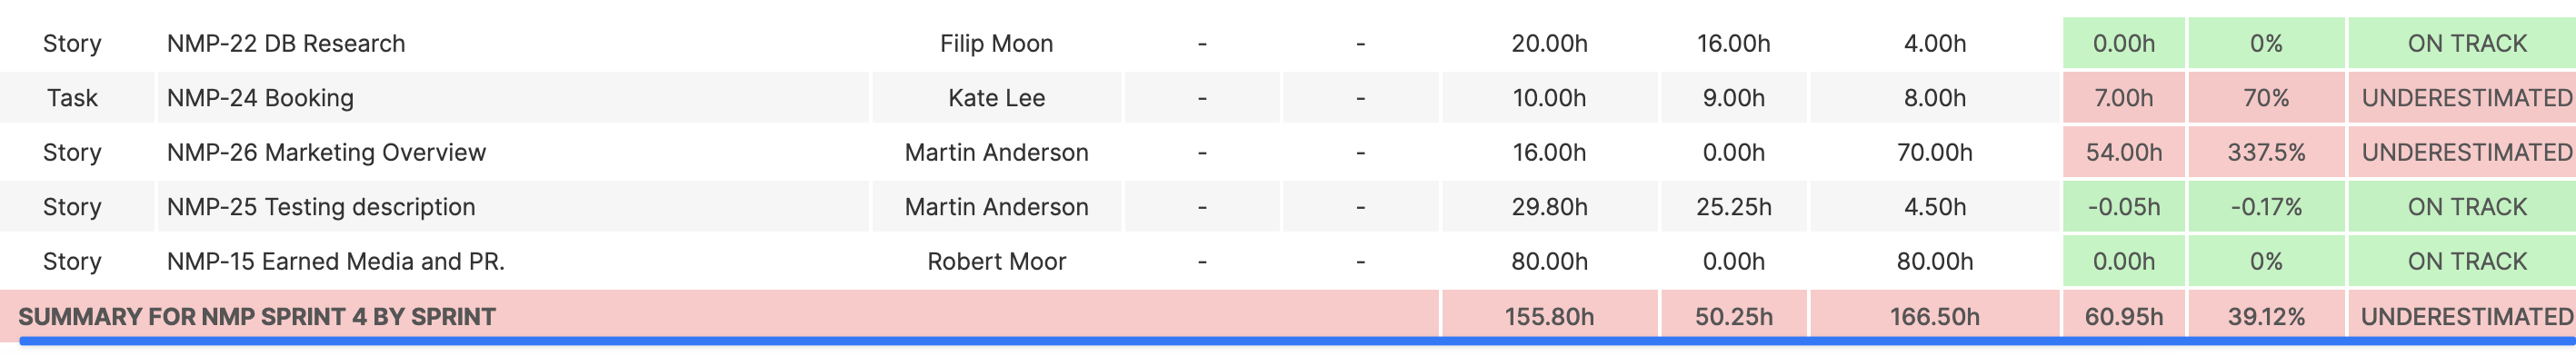
Group By: Enabling grouping allows further analysis of data by showing the summary for the grouped category.
Example
If you select Group By Sprint, a summary row will be displayed, providing an overview of the sprint’s overall status.
-
Generating the Report
Once all parameters are configured, click the Create button. The system will generate a report based on the selected criteria, presenting insights into workload and utilization trends.
-
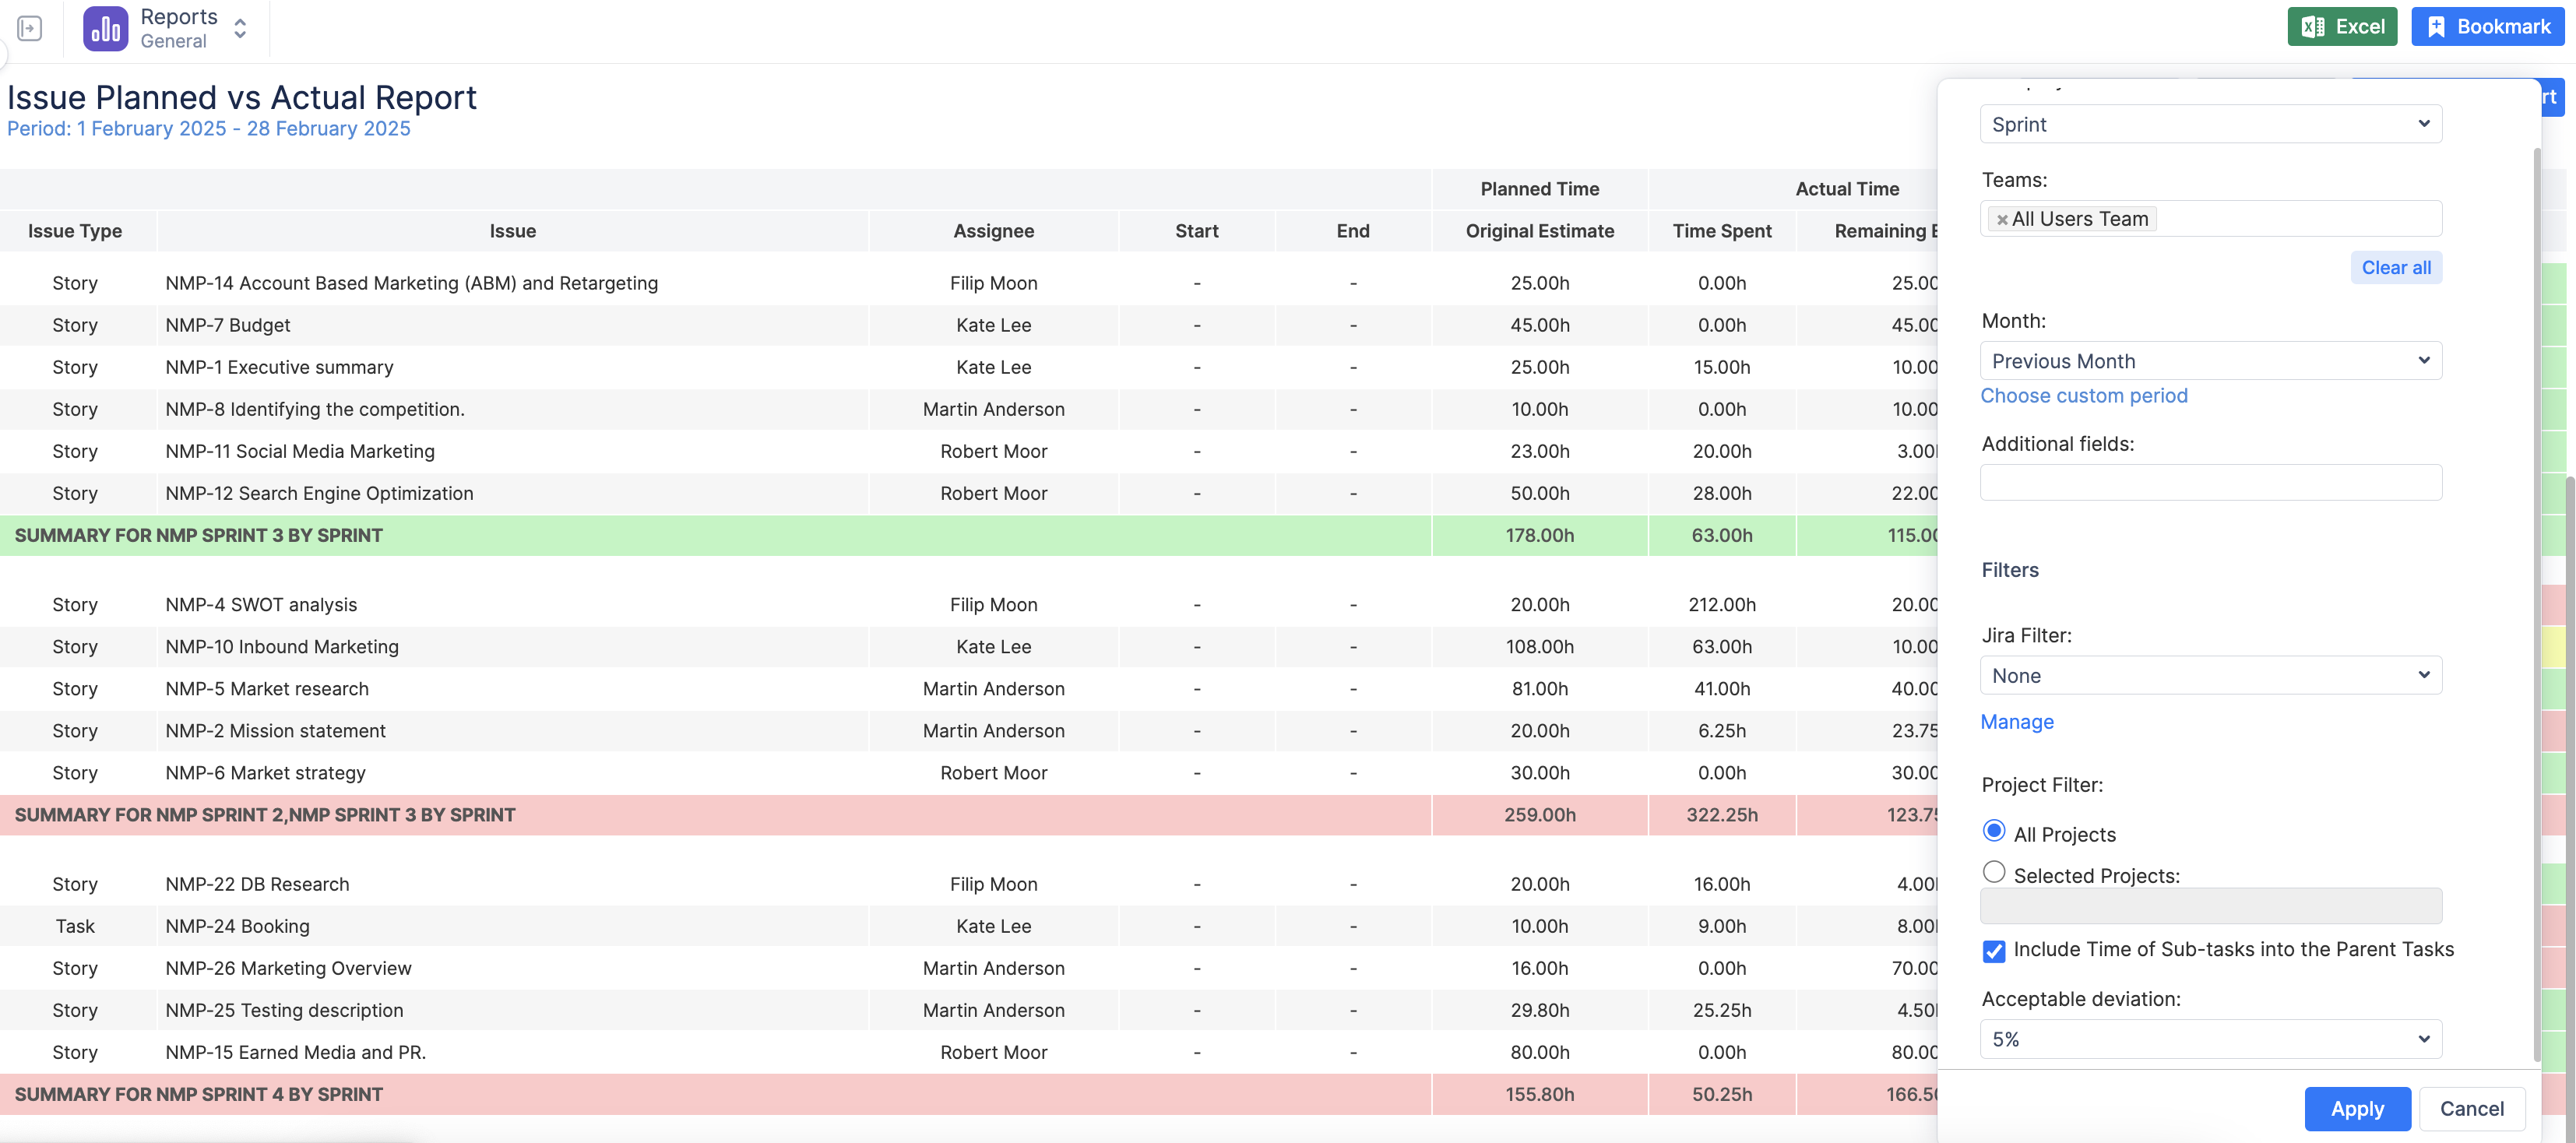
Customizing the Report After Creation
Once the report is generated, you can further refine and adjust it dynamically by clicking on the
-
Modify Group By setting.
-
Modify the Team: Adjust the team selection if needed.
-
Edit the Period: Change the reporting period or use the Custom Period option to define a specific timeframe.
-
Modify Additional Fields: When Info by is set to Issue, Epic, or Jira filter, you can extend this report by adding information from Jira custom fields directly to the report.
-
Apply Filters: Modify Jira filters or project filters as needed.
-
Enable ‘Show Details in Percentage’: Toggle this option to display utilization details in percentage format or in hours/days.
-
Check 'Exclude Time of Sub-tasks from Time of Main Task' or leave it unchecked
-
if an option is checked, the system will not aggregate the estimates / logged time from the sub-tasks and provide a value of time estimated and time spent on a main task
-
if an option is not checked, the system will aggregate the estimates / logged time from all the sub-tasks of a main task.
-
-
Change Acceptable deviation.
-
After making adjustments, click Apply to refresh the report with updated settings in real-time.
-
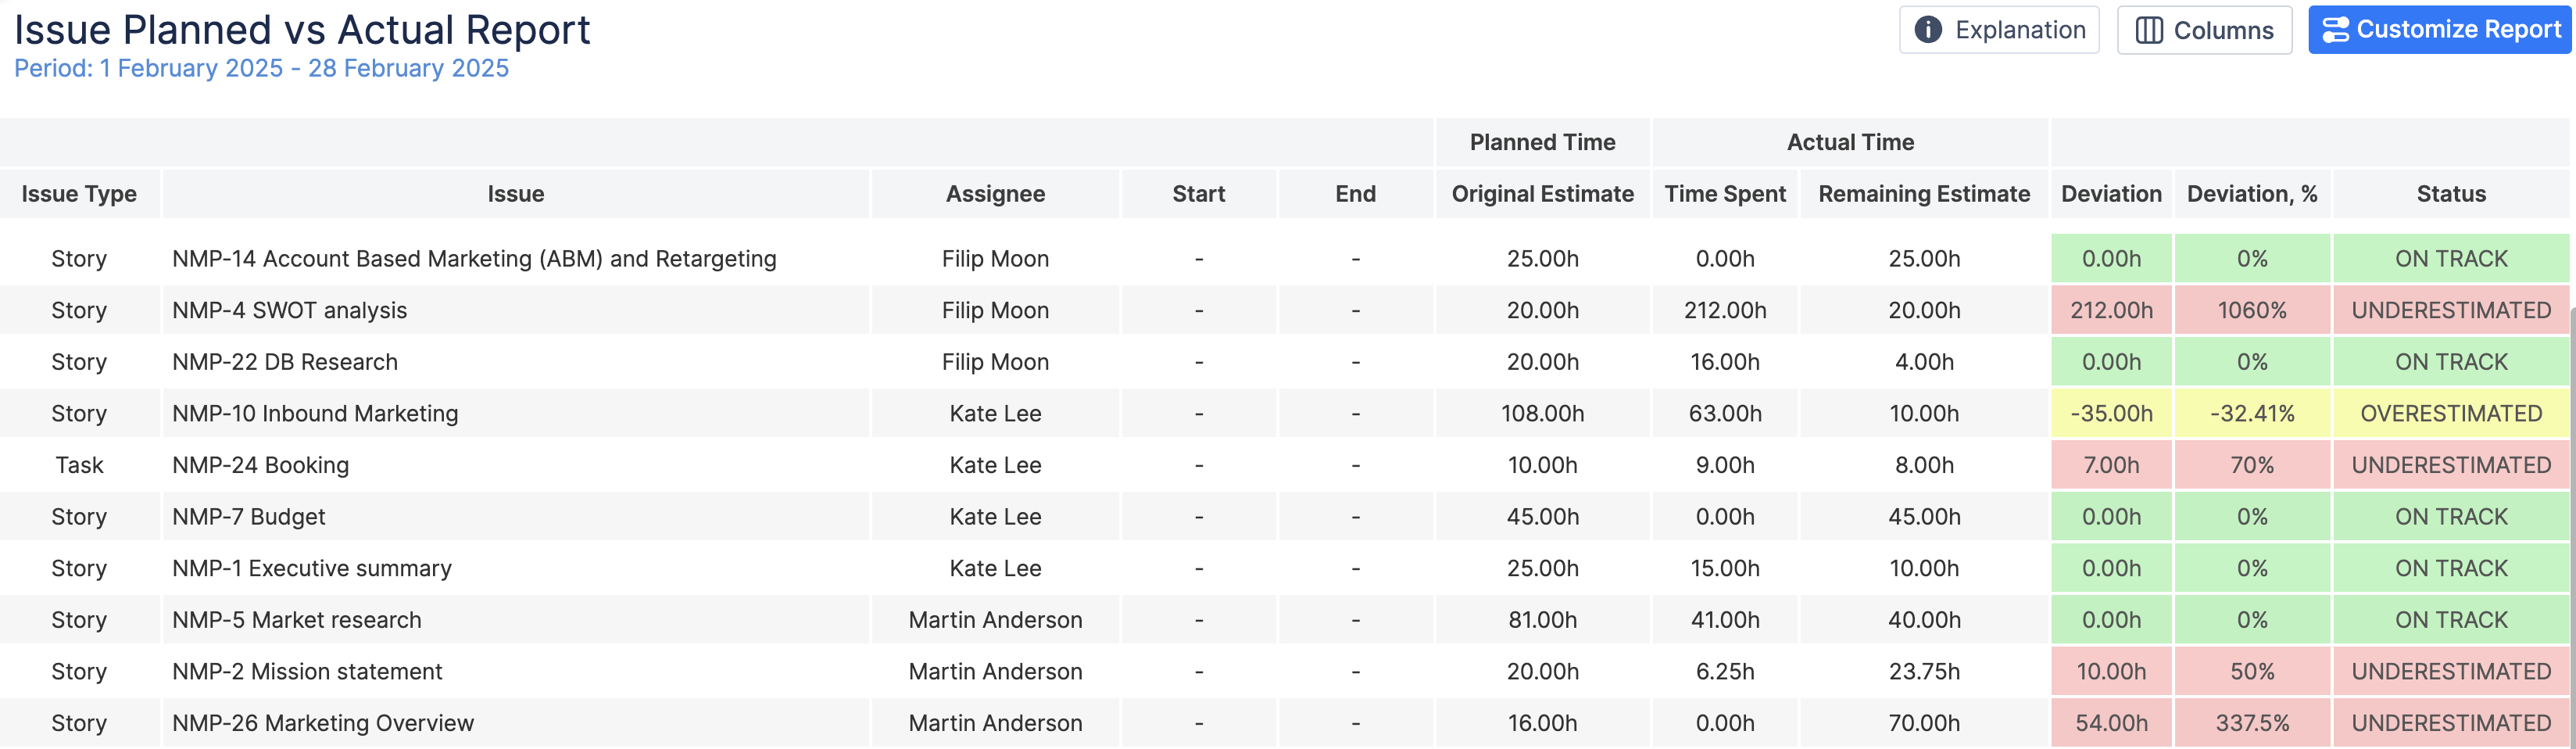
Understanding the Report Outcome
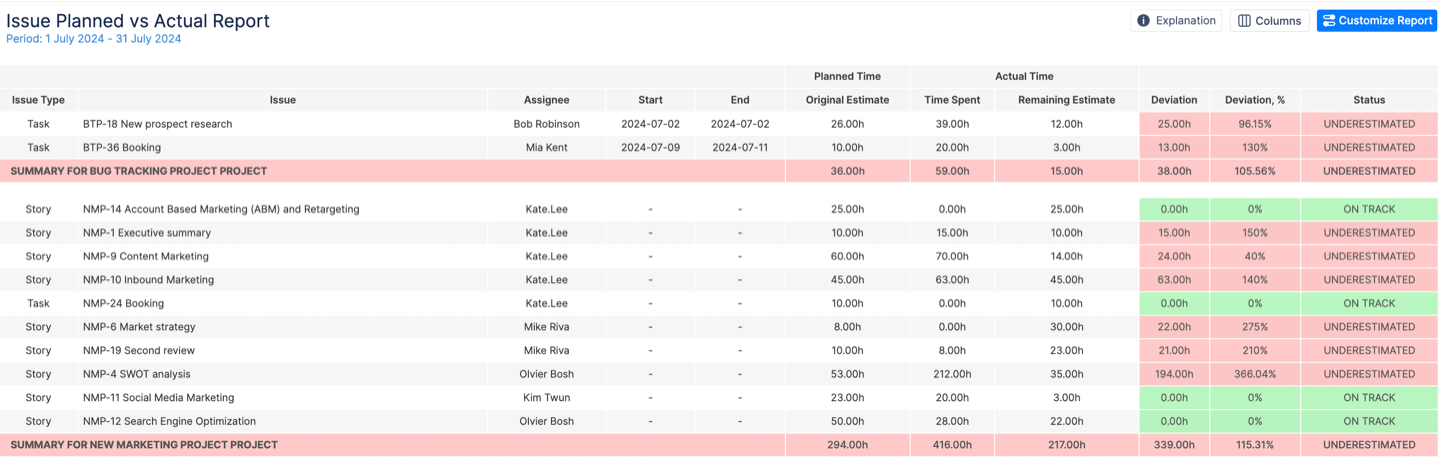
A report represents the collected data about JIRA tickets, a person who was the last assignee, Start and End Dates, Original and Remaining Estimates, Time Spent (logged work), Issue Summary, and Status.
The status of a ticket is marked with different colors:
-
green - ON TRACK status, means that Time Spent + Remaining Estimate = Original Estimate
-
yellow - OVERESTIMATED status, means that Time Spent + Remaining Estimate < Original Estimate
-
red - UNDERESTIMATED status, means that Time Spent + Remaining Estimate > Original Estimate
-
A color-coded visualization helps identify workload distribution.
For a more comprehensive guide on this report, please, refer to the video guide: