The Timeline report provides a comprehensive export of all the data visible on users’ timelines, including issues assigned, events, time off, workload, and worklogs, into an Excel format. This functionality allows you to capture a complete snapshot of resource allocation at any given time.
To generate Timeline Report follow the steps:
-
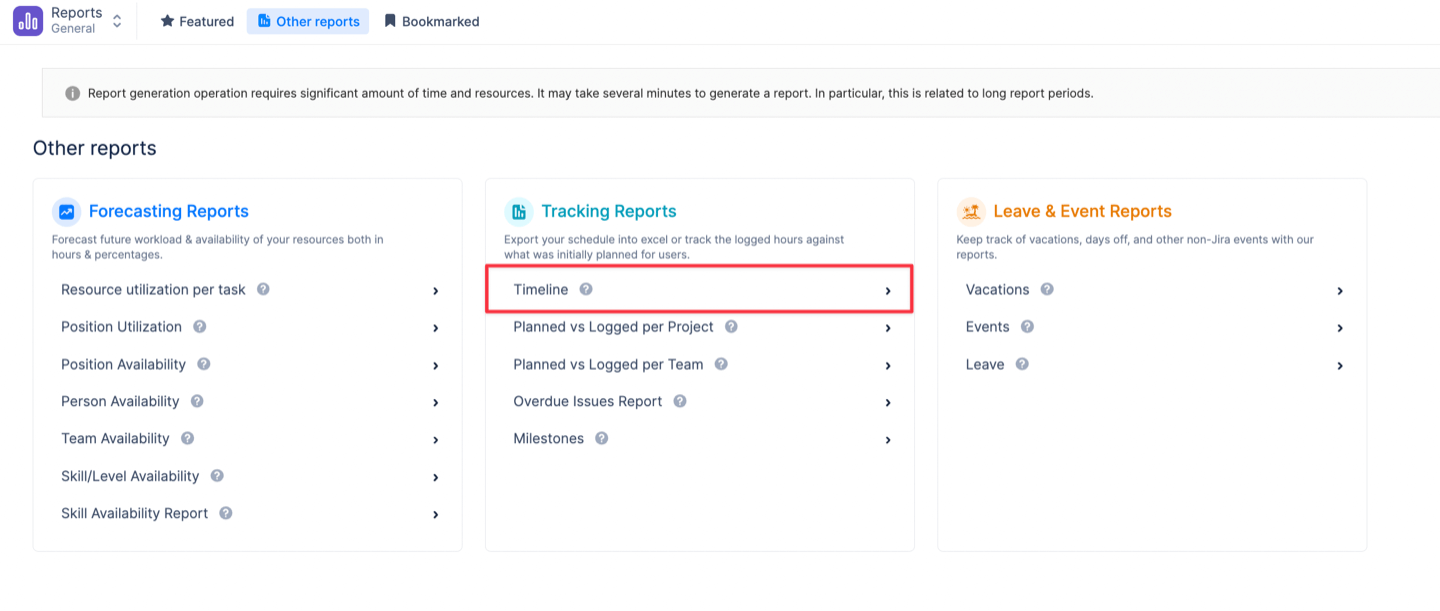
Navigate to Reports → Other Reports -> Find the desired report in the list:
-
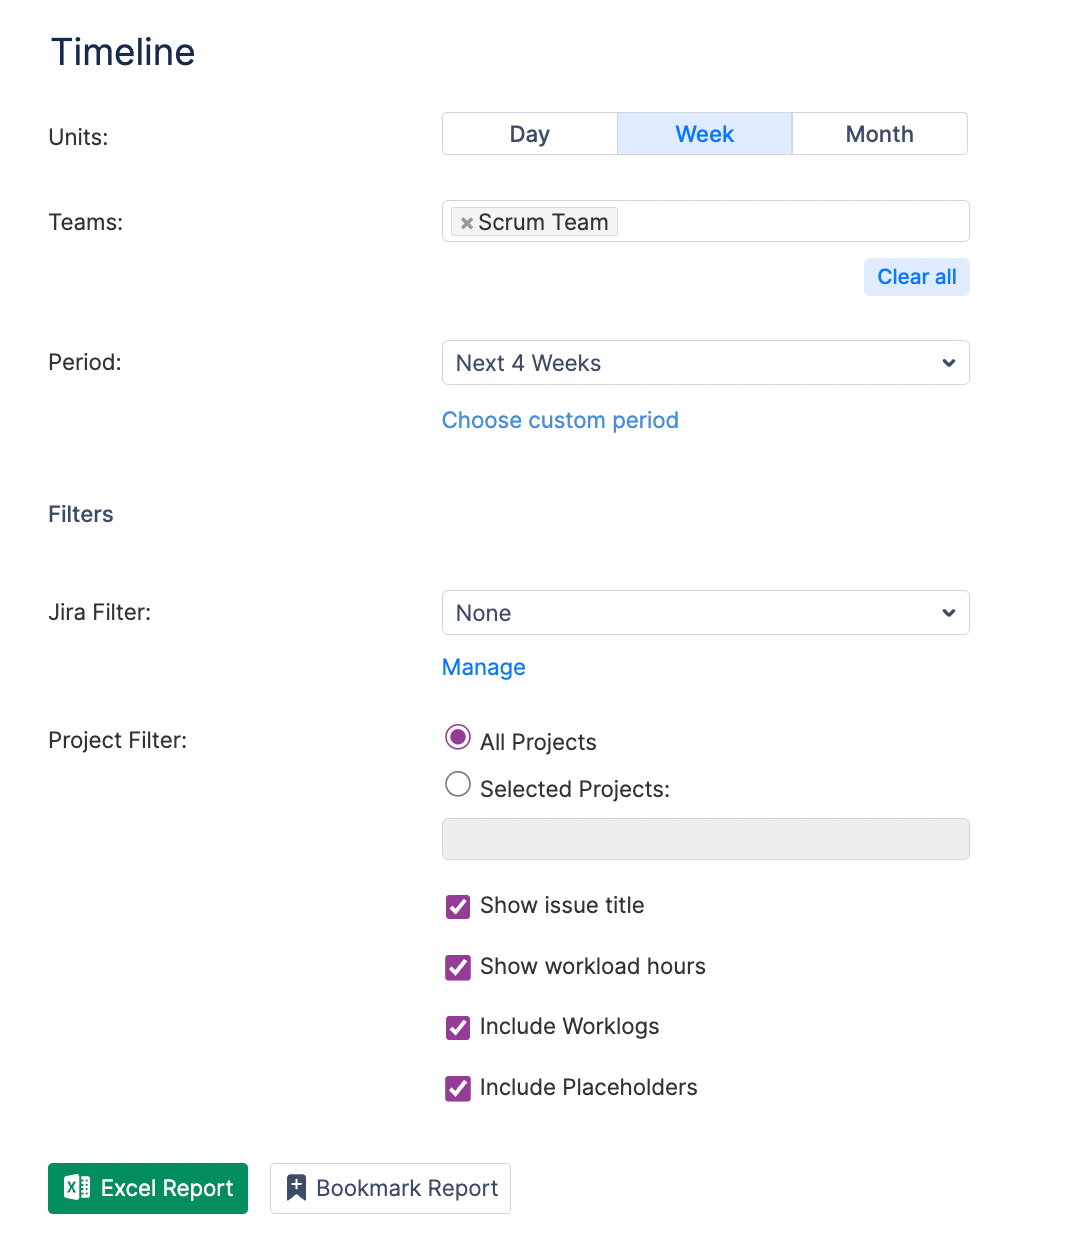
Select the display units the data to be grouped by – day, week or month.
-
Select a Team the report is to be generated for.
-
Select a Period the report is to be generated for.
-
Apply project filters or Jira filters if needed.
-
Check 'Show issue title' option
-
Check the 'Show workload hours' option
-
Check the 'Include Worklogs' option
-
Check the 'Include Placeholders' option
-
Generate Excel report:
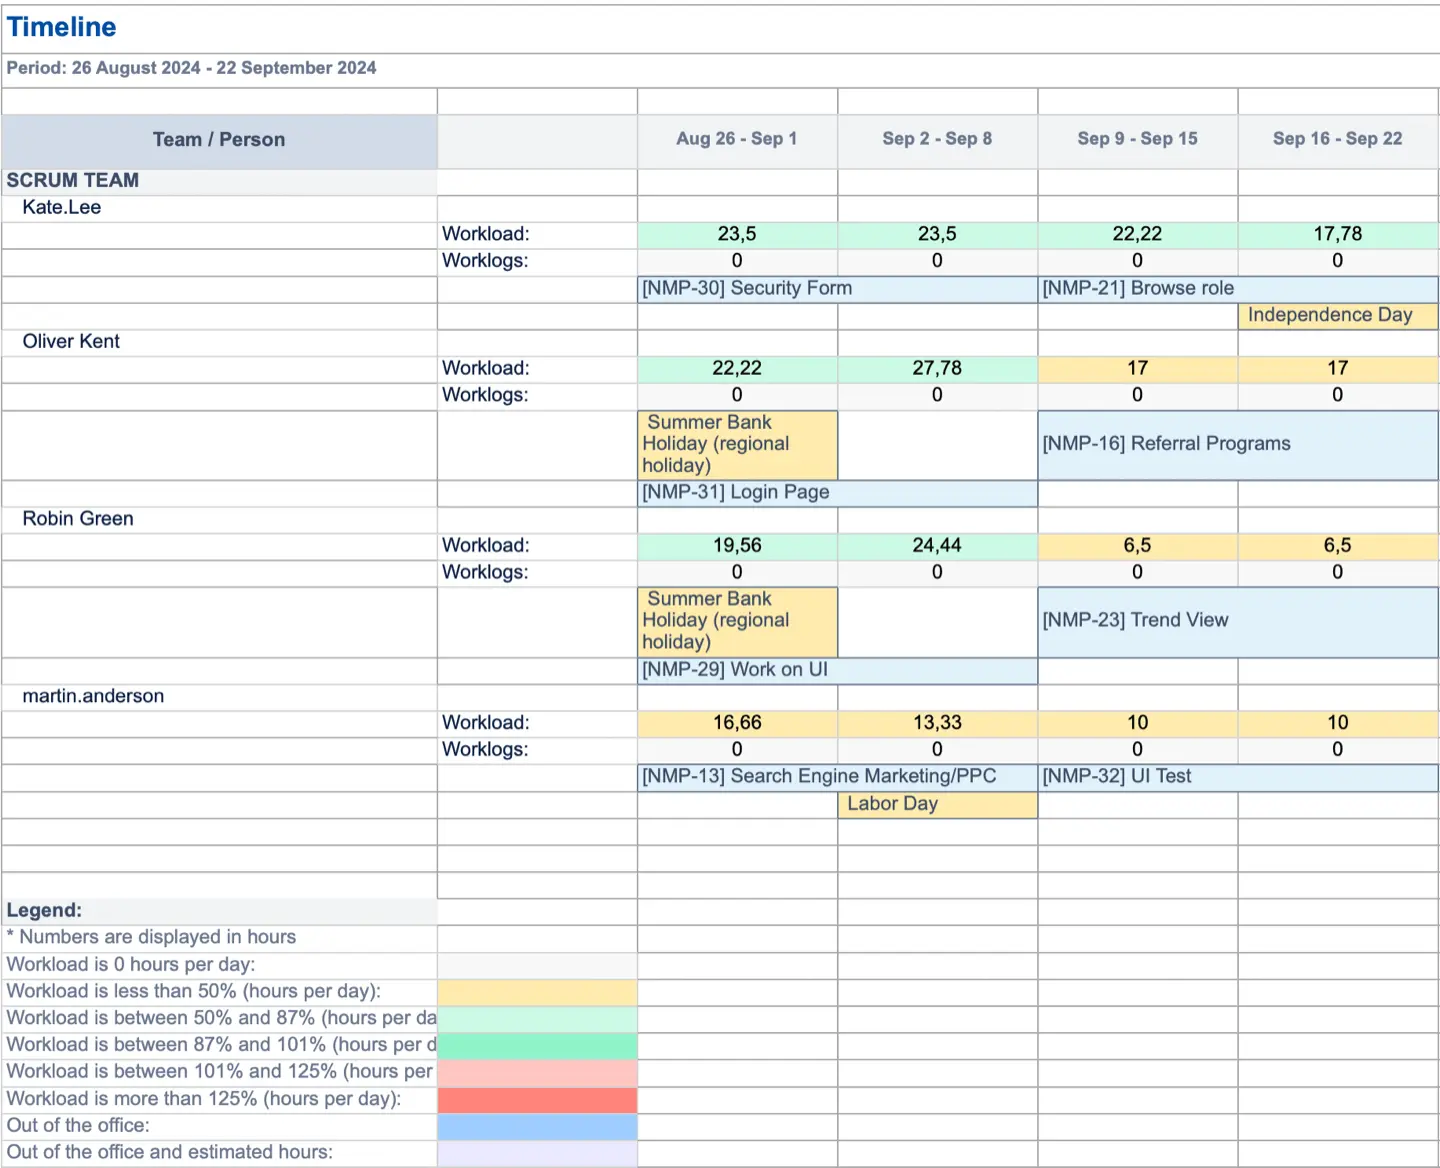
Timeline Report is downloaded in Excel format: