
Project Resources Forecast provides a breakdown of team members’ scheduled work by project over a specific period from a project perspective. Similar to the Resource Utilization Forecast, it is generated based on all tasks and events scheduled on users’ timelines.
Report Overview
Here’s what it does:
-
Project-Specific Breakdown: This report focuses on resource allocation across different projects, giving a detailed view of how each person’s time is distributed within individual projects.
-
Data Sources:
-
Jira Tasks: Based on the remaining estimates, daily estimates or SP of Jira tasks assigned to each person.
-
Events: Includes bookings and placeholders on user timelines for each project.
-
Capacity Calculation:
-
Total: Shows the total number of hours allocated to each person for the selected projects.
-
Week-by-Week Breakdown: The report is organized to display weekly scheduled hours for each individual within each project, allowing you to track how much time is dedicated to each project over the upcoming weeks.
-
Customization: You can filter the report by specific projects, teams, and Jira filters. It also allows you to choose whether to include issues, placeholders, and booking items for a comprehensive view of resource allocation.
-
Level of Detail: This report can be generated also with various levels of detailization providing breakdown of the allocation per Project, Epic, or Initiative.
Report Generation
-
Selecting the Reporting Criteria
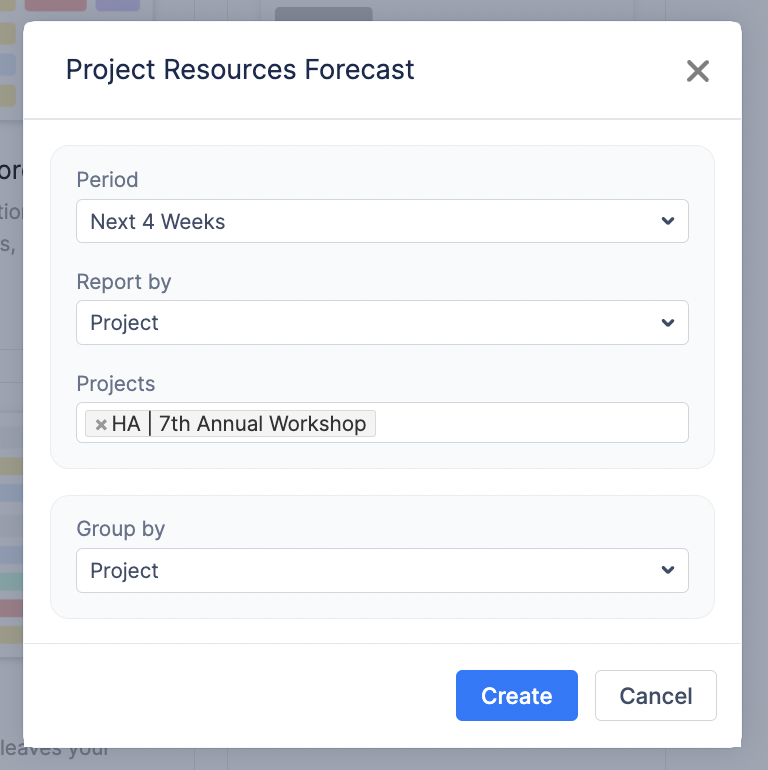
To generate a report, configure the following parameters:
-
Period: Choose the time frame for the report from a predefined list (e.g., Next 4 Weeks, Next Month, etc.).
-
Report By: Defines the data source for the report. You can generate a report for a specific Project, Initiative, Epic, or Jira Filter (to apply custom Jira queries).
-
Projects: If “Project” is selected in the “Report By” field, specify the list of projects to include.
-
Group By: By default, reports display project grouping. However, you can further group data by: Epic, Initiative, and other Jira Custom Fields.
If you use the split functionality and want to see total allocations for a task, choose ‘Issue’ in Group By.
-
Generating the Report
Once all parameters are configured, click the Create button. The system will generate a report based on the selected criteria.
-
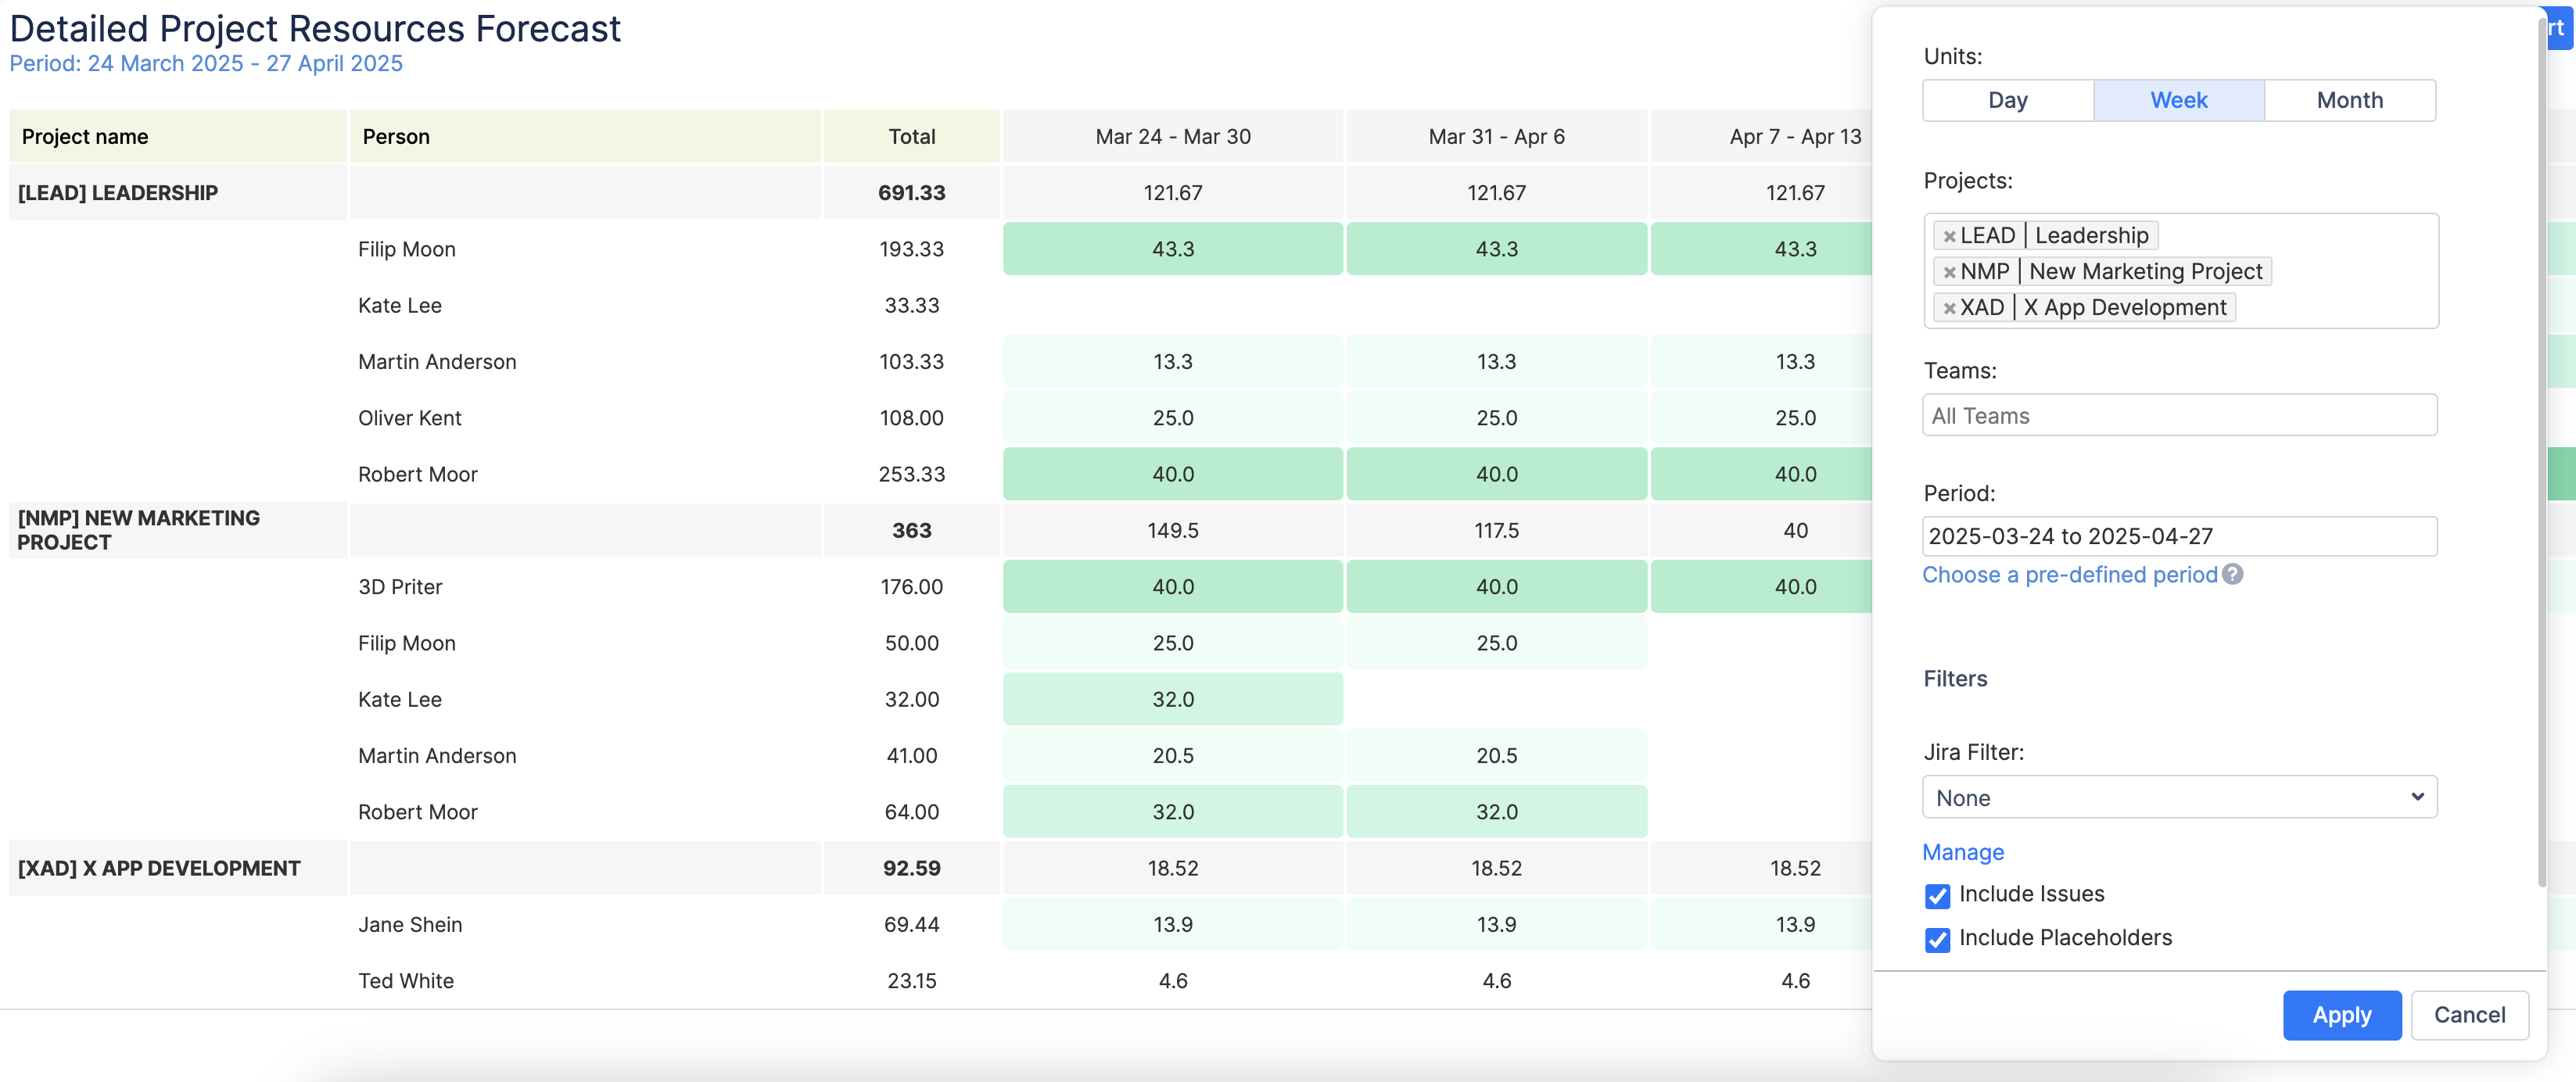
Customizing the Report After Creation
Once the report is generated, you can further refine and adjust it dynamically by clicking on the
-
Change Display Units: Choose whether to view data by Day, Week, or Month for better visualization.
-
Apply Filters: Modify Jira filters or project filters as needed.
-
Modify the Team: Adjust the team selection if needed.
-
Edit the Period: Change the reporting period or use the Custom Period option to define a specific timeframe.
-
Select Data Sources: Choose whether the report should be based on Jira Issues, Placeholders, Bookings.
-
After making adjustments, click Apply to refresh the report with updated settings in real-time.
-
Understanding the Report Outcome
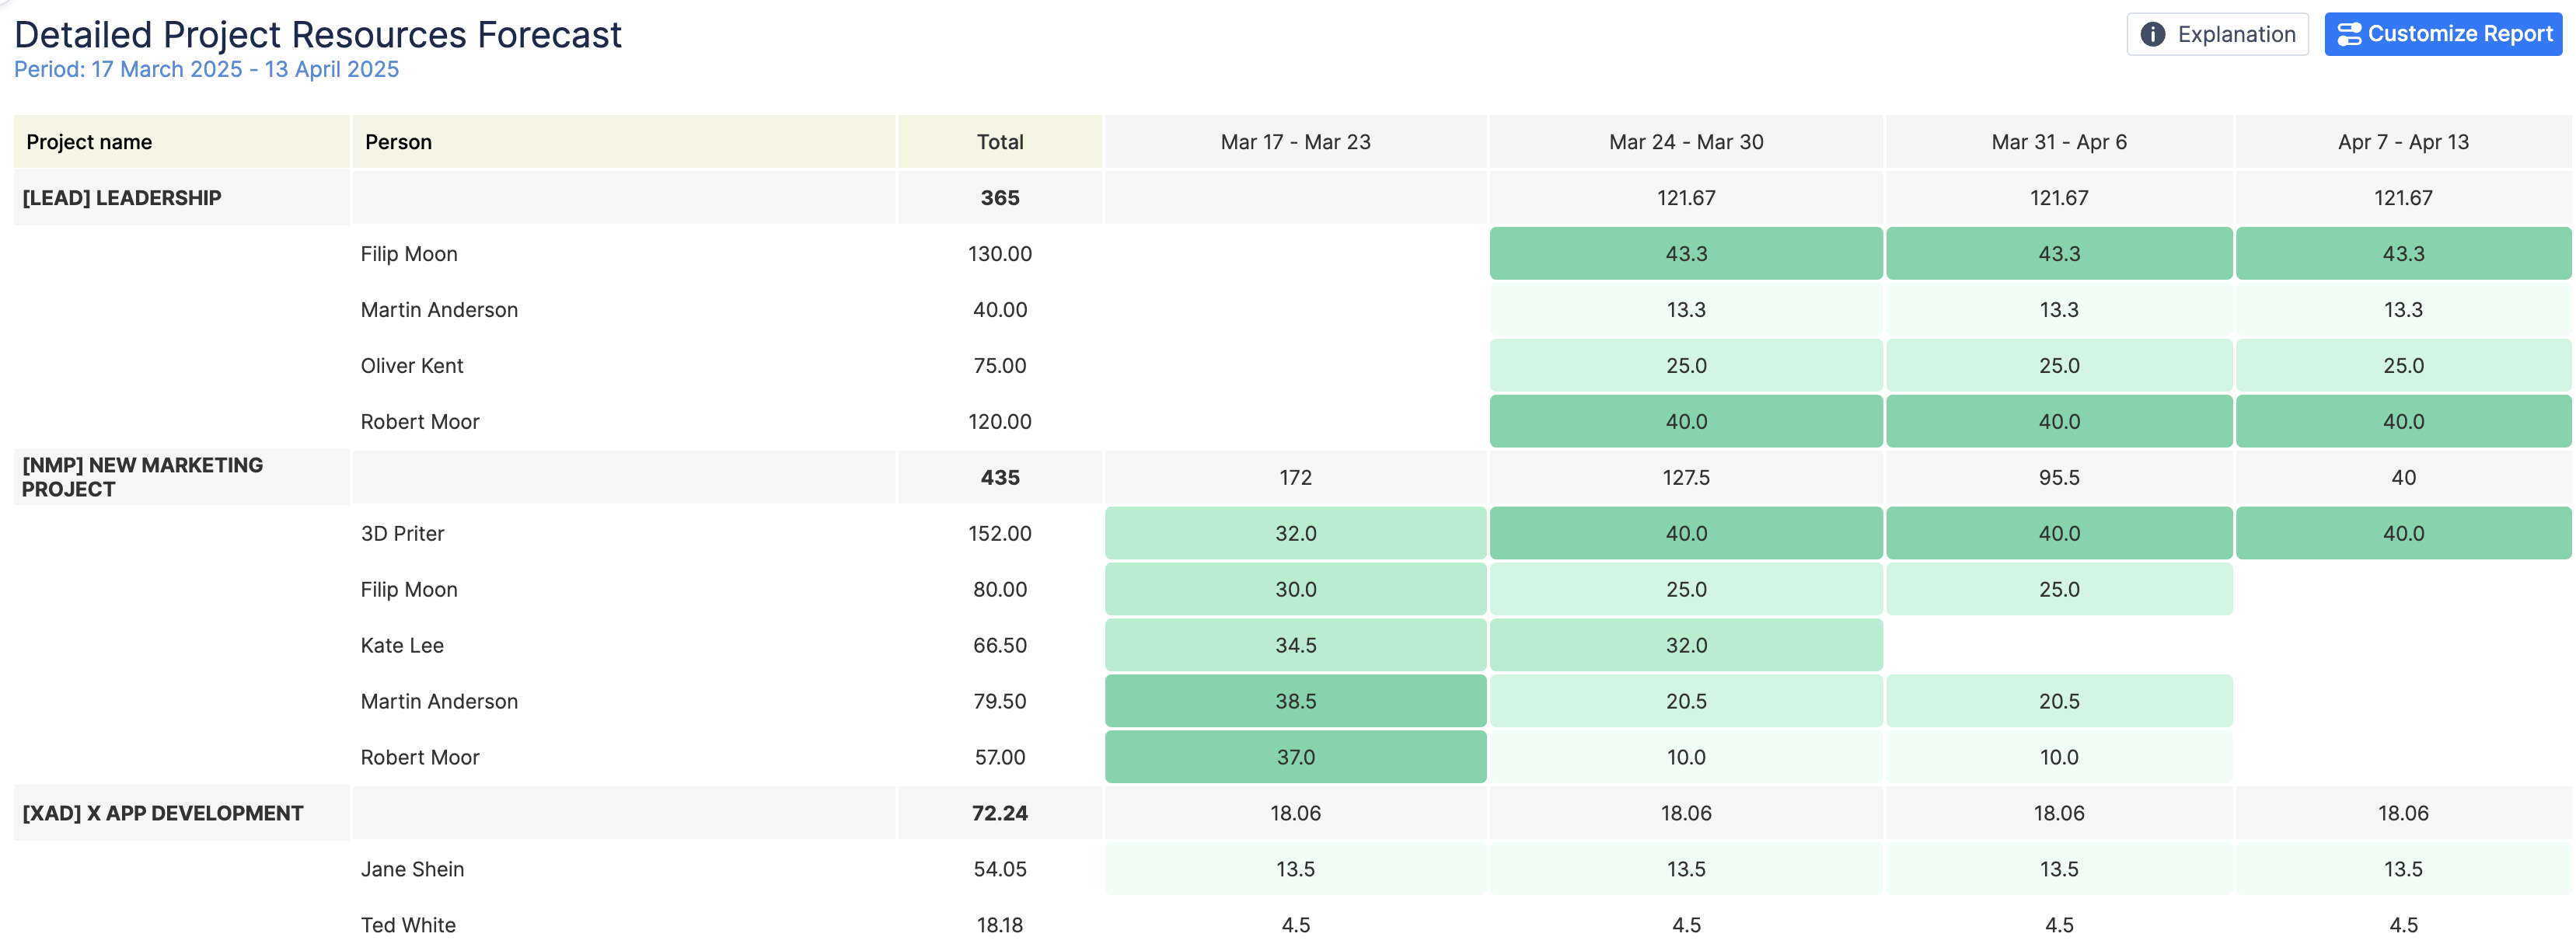
The Detailed Project Resources Report provides an in-depth breakdown of resource allocation across multiple projects over a specified period.
-
The top row for each project aggregates the total hours assigned to all team members for that project.
-
Each individual’s column breaks down their allocated hours across different weeks.
-
If an individual has a value empty in a given week, they were not scheduled for any work in that timeframe.
-
This breakdown allows for quick identification of workload distribution across projects, epics, tasks and etc.
-
Heatmap view
Each weekly, daily, or monthly cell is color-coded based on the number of hours or days allocated for that period. The heatmap uses white and four shades of green:
-
White indicates no or minimal allocation.
-
Light green to dark green represent increasing levels of allocation, with dark green showing the highest allocation.
The heatmap is relative, meaning the colors are scaled based on the maximum allocation in the report:
-
The darkest green corresponds to the highest value.
-
Other shades represent approximately 75%, 50%, and 25% of that value.
This visual representation allows users to:
-
Quickly identify periods of high and low resource usage.
-
Monitor resource trends over time for better planning.
If the option 'Users log worked time' is activated in General Configurations, this report will exclusively display data for the present and future, as historical information is captured in worklogs (Time spent).
If you're estimating tasks with Story Points or Daily Estimate, make sure to select the 'Users do not log worked time' option. This is important because Story Points represent the effort needed for a task and don't change over time, unlike hours. So, even if you log time, your Story Points will stay the same and need to be spread out over the task's duration. The same applies to Daily Estimate. In this case report will show data for past and for future.