
What it does
The Reports module consolidates ActivityTimeline’s planning and analytical reports into one place.
Use this module to analyze:
-
workload and capacity,
-
resource utilization,
-
project progress,
-
planned vs actual performance,
-
leave and availability.
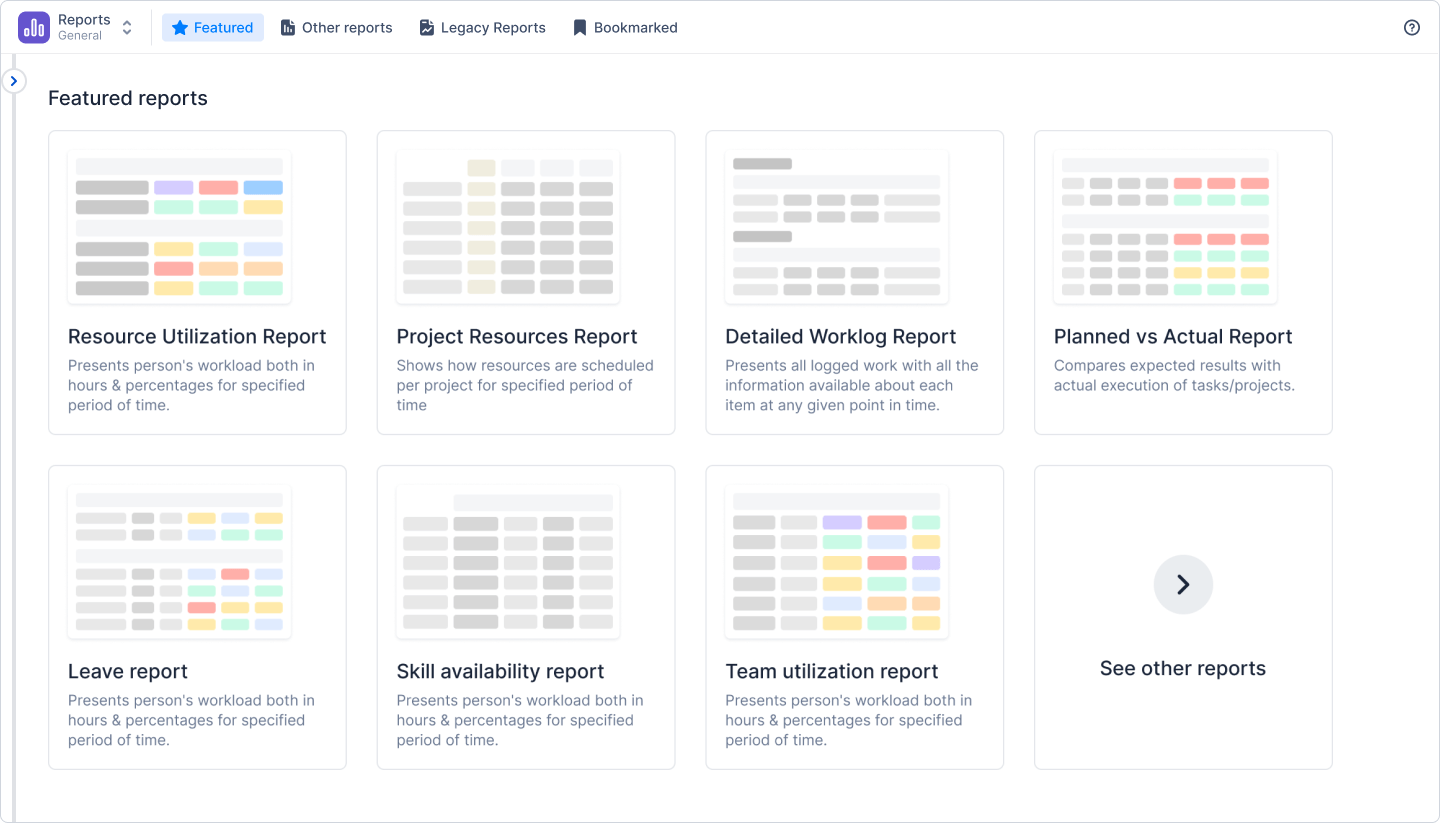
If you’re looking for timesheets, you’ll find them in the Timesheets module. The Reports module focuses on forecasting, planning, and management insights built on top of your ActivityTimeline and Jira data.
Required Permission
-
Administrator Role;
-
Manager Role;
-
Power Employee Role - have rights to extract the reports for yourself ‘Only Me’
-
Employee Role - have rights to extract the reports for yourself ‘Only Me’
-
Limited Employee Role - have rights to extract the reports for yourself ‘Only Me’
-
Team Manager Role - have rights to extract the reports for yourself ‘Only Me’ and Teams he/she belongs to.
How Reports Work
Reports collect data from Jira and ActivityTimeline and present it in different formats depending on what you want to analyze.
Most reports can also be exported to Excel or embedded into Jira dashboards.
Report Categories
-
Resource Reports focus on people and capacity.
Use them to answer questions such as:
-
Who is overloaded?
-
Who still has available capacity?
-
Which skills are available?
-
How is work distributed across teams?
-
-
Project Reports focus on projects rather than people.
Use them to:
-
monitor project progress,
-
compare planned and actual effort,
-
identify schedule deviations.
-
-
Leave & Event Reports focus on availability.
Use them to analyze:
-
time off,
-
custom events.
-
Examples of Available Reports & Charts
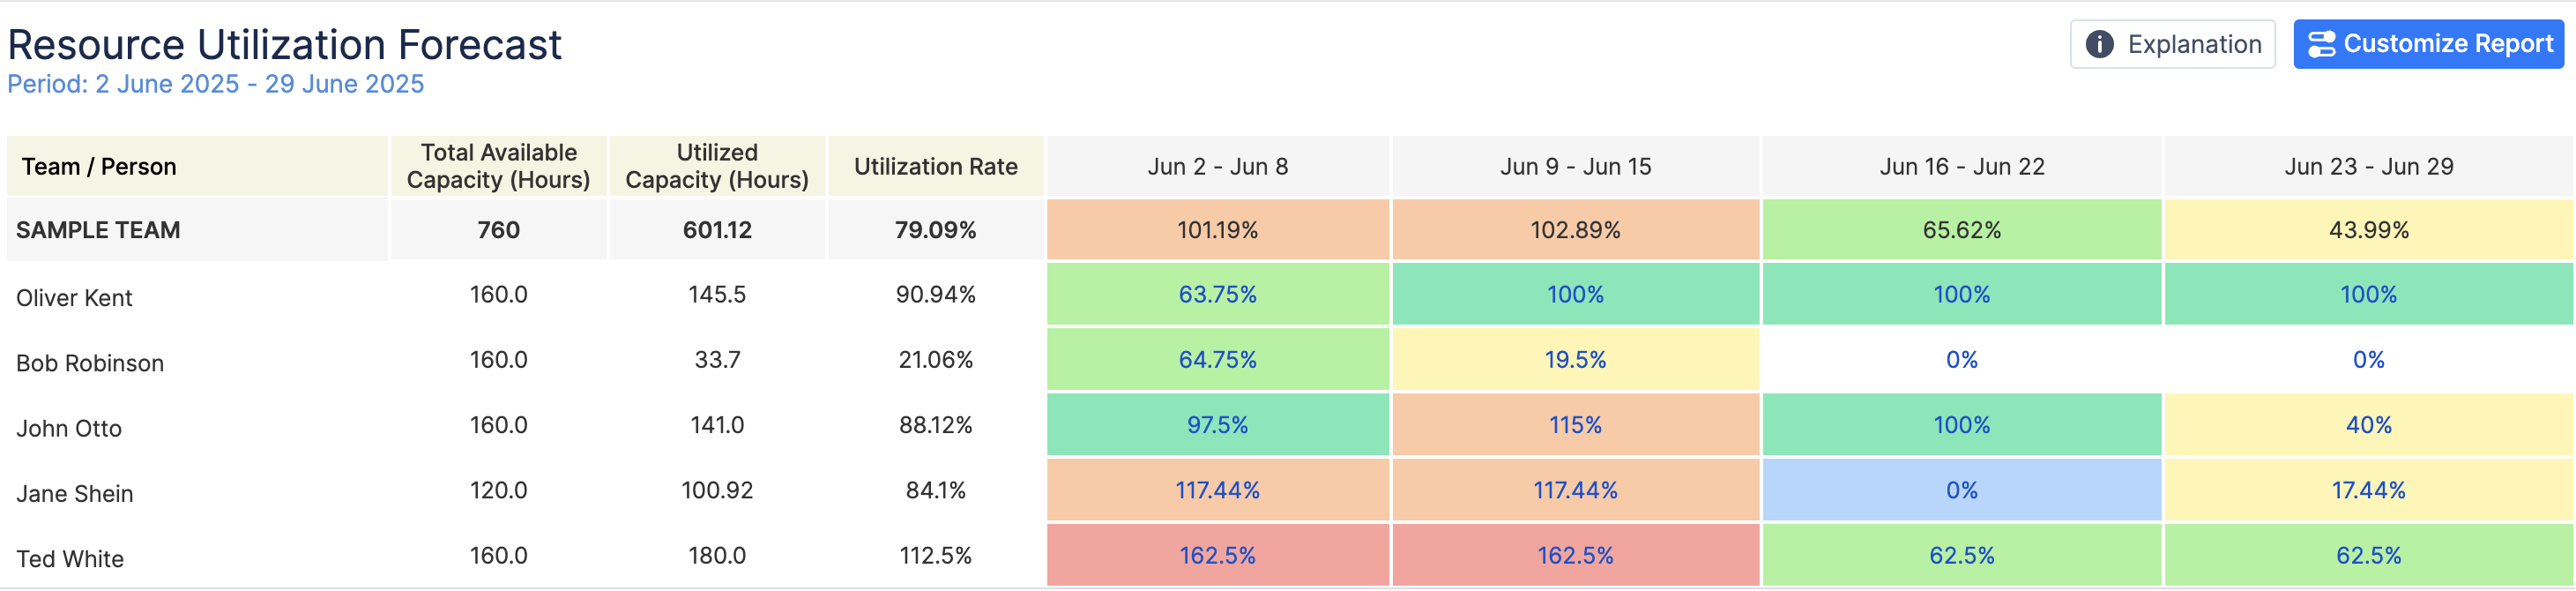
Resource Utilization Forecast
Get a clear picture of resource utilization and improve your resource capacity planning.
Understand whether your resources are utilized to the fullest extent, track workload, and prevent the work over- or underload.
The report is available on both team & individual levels to see total available & used capacity.
Team Capacity Chart
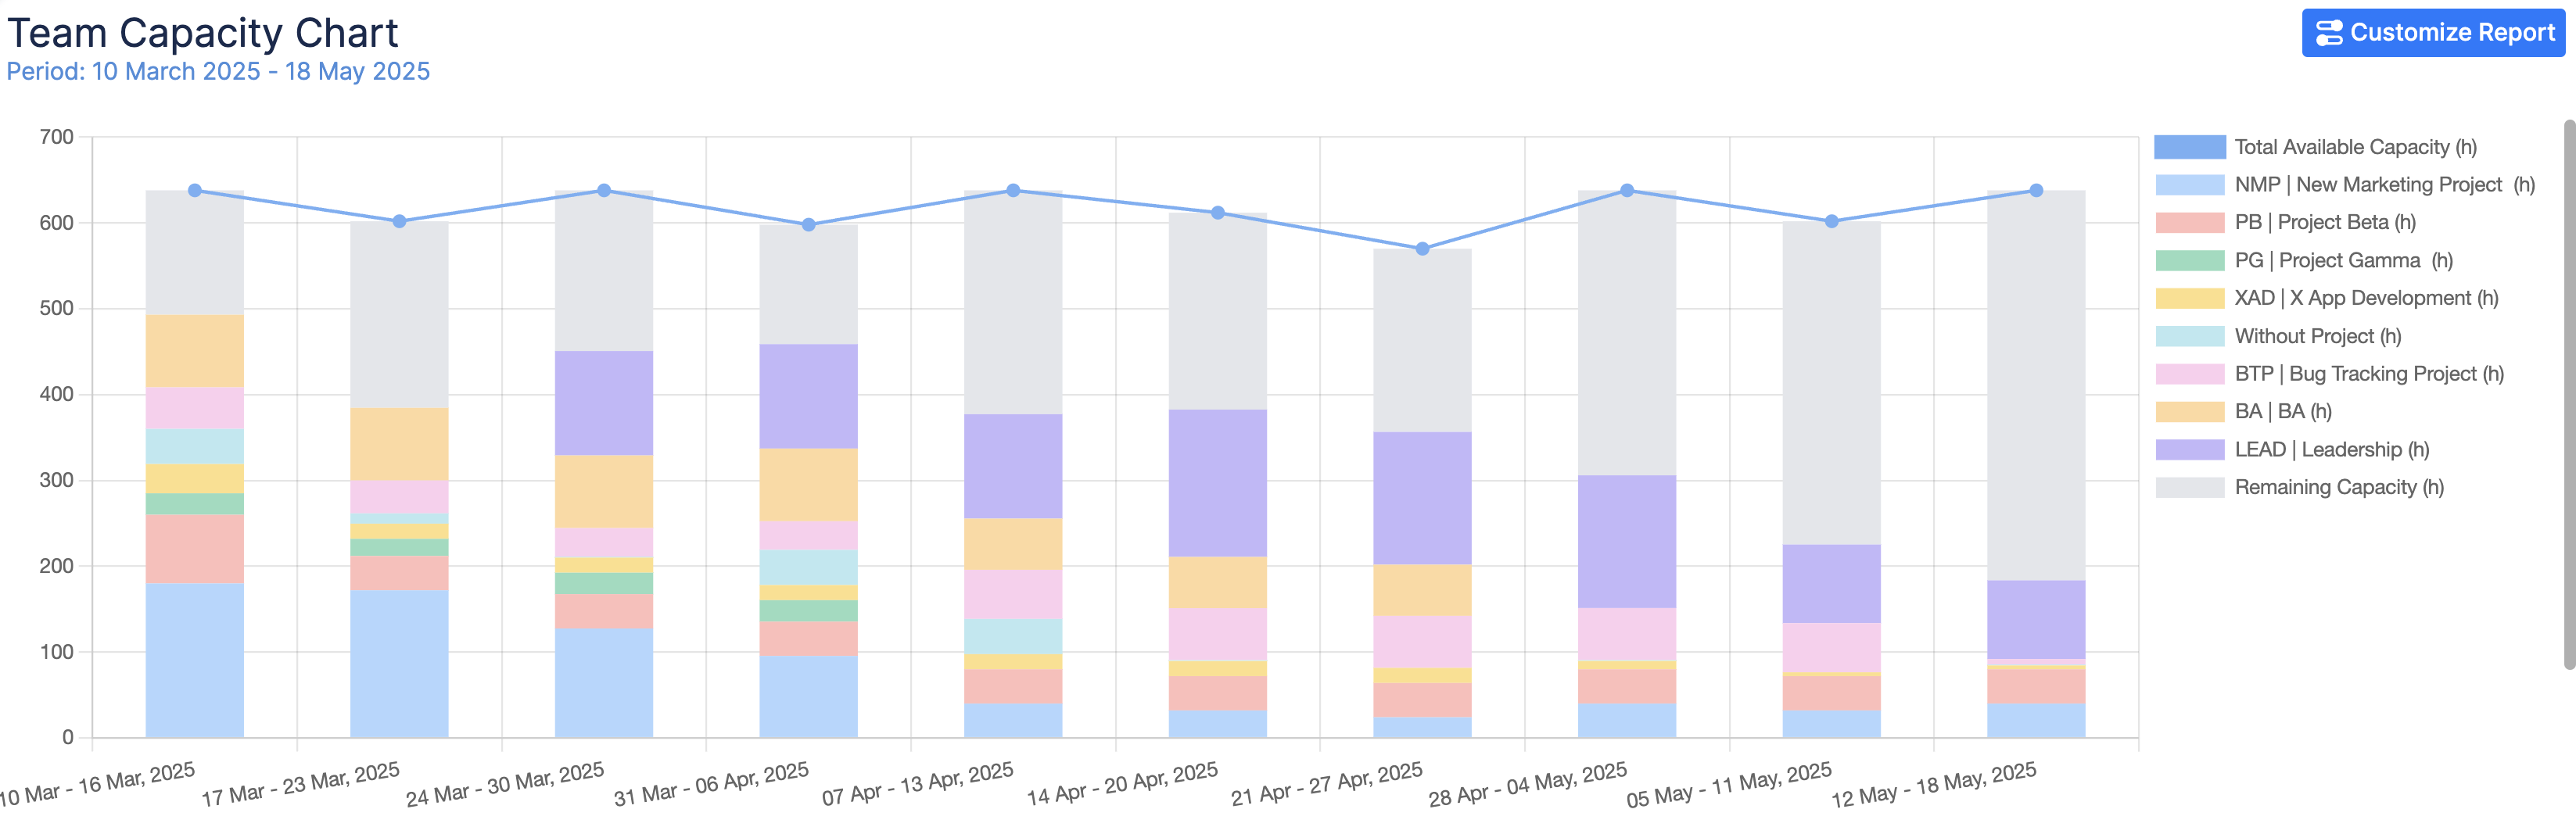
With the Team Capacity Chart, you can visualize your team’s total capacity and how it is allocated across projects over time.
Identify periods of available or remaining capacity, detect potential overload, and understand how work is distributed between projects.
Choose a team and time frame to monitor resource allocation and ensure capacity is balanced to meet upcoming demand.
Planned vs Actual Report
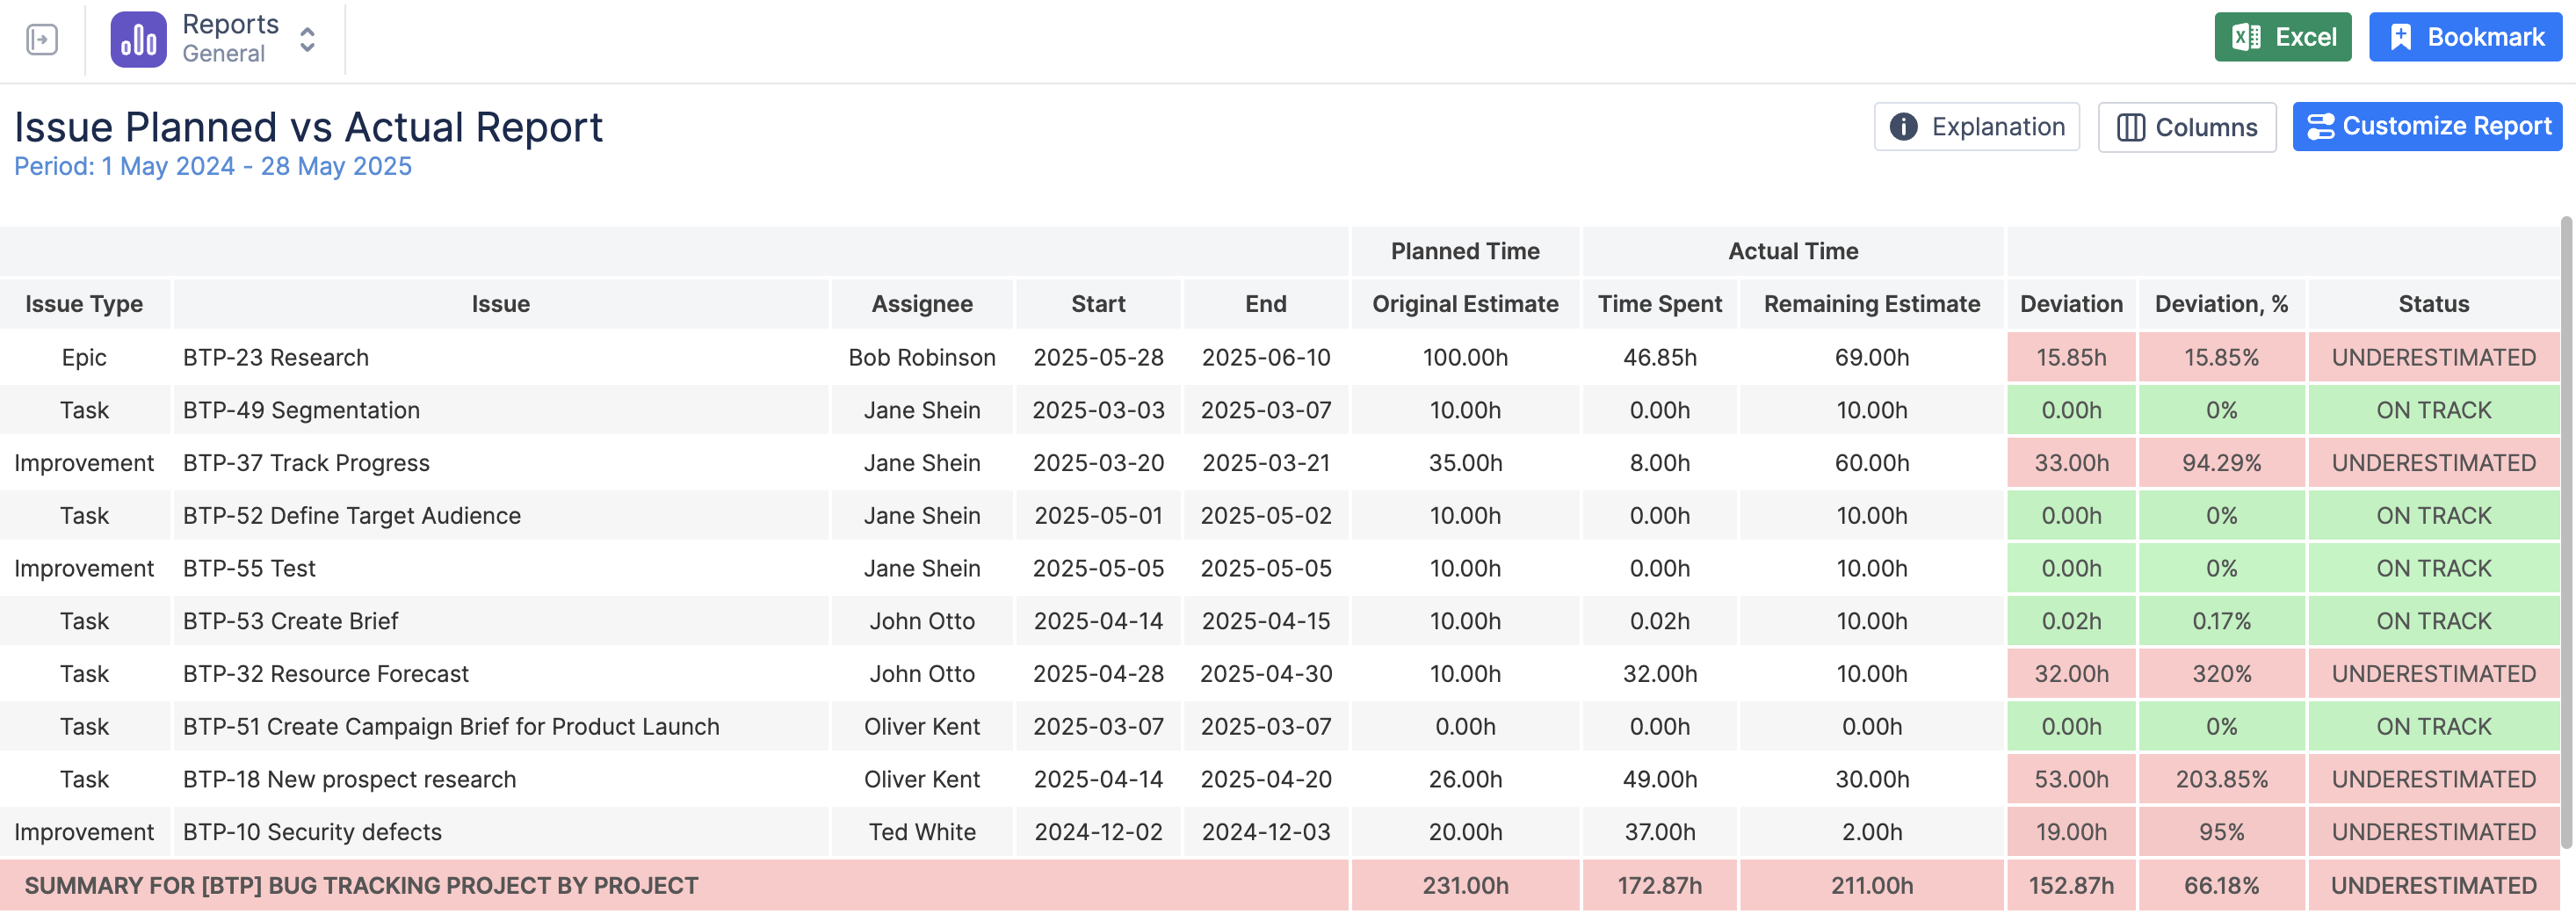
With the help of the Planned vs Actual report, you can compare expected results with the actual execution of tasks/projects.
Spot the difference between original estimate & actual execution to understand the bottlenecks of the project.
Choose a project and team, time frame, and acceptable deviation, which shows to which extent your project can be delayed.
How Reports Connect to Other Modules
Reports bring together information from the rest of ActivityTimeline:
-
Planner provides planned work
-
Workspace provides day-to-day execution
-
Timesheets provide logged time overview
-
Reports combines this information into insights
Why This Matters
Reports help managers and teams make better decisions by turning planning and time-tracking data into meaningful insights.
They help you:
-
balance workload
-
improve resource utilization
-
monitor project health
-
compare planned and actual work
-
identify trends
-
support planning with data instead of assumptions
Learn More
For more information refer to the following sections: