
Resource Utilization Forecast provides an overview of a team’s expected workload for the future.
Report Overview
Here’s what it does:
-
Workload Forecast: It projects the workload for each team member over a specified period, based on all scheduled tasks and events on the users’ timelines.
-
Data Sources: The forecast includes:
-
Jira Tasks: Based on the remaining estimates, daily estimates or SP of assigned and scheduled on the timeline tasks.
-
Events: Includes bookings and placeholders added to the users’ timelines.
-
Capacity Calculation:
-
Total Available Capacity: This is the total number of hours a user is available, calculated by taking the user’s full capacity (e.g., work hours per week) and subtracting any time off, such as vacations, sick leave, or other scheduled time off.
-
Utilization Rate: Shows how much of each team member’s capacity is utilized by calculating the percentage of their available hours that are allocated to tasks and events.
-
Utilized Capacity: This represents the number of hours scheduled (tasks, events) for the person within the selected time period.
-
Future Utilization Trends: The report breaks down the utilization rates week by week, giving insights into the team’s workload distribution over time. This allows you to spot under- or over-utilization in advance.
-
Customization: You can filter the report by Jira filters, and specific projects, and choose between displaying the data in hours or percentage (In summary report type). The inclusion of placeholders, booking items, and detailed percentages helps provide a comprehensive view of the team’s upcoming workload.
-
Level of Detail: This report can be generated also with various levels of detailization providing a breakdown of the allocation per Project, Epic, or any Jira custom field.
Report Generation
-
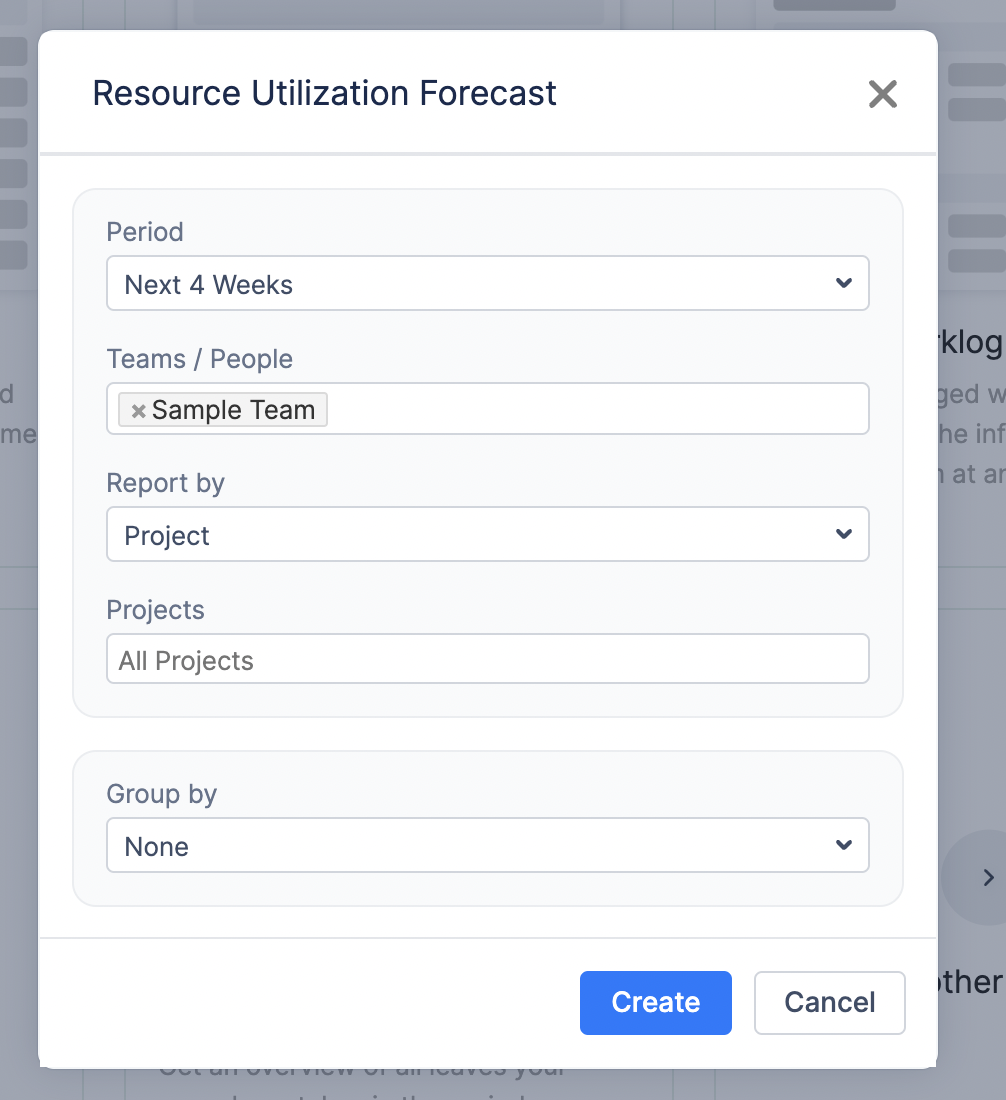
Selecting the Reporting Criteria
To generate a report, configure the following parameters:
-
Period: Choose the time frame for the report from a predefined list (e.g., Next 4 Weeks, Next Month, etc.).
-
Teams / People: Select the team or individual for whom the report should be generated.
-
Report By: Defines the data source of the report. By default, the report includes all scheduled activities for the selected user or team, but you can filter the data by: Project, Initiative, Epic, Jira Filter (to apply custom Jira queries).
-
Projects: If “Project” is selected in the “Report By” field, specify whether the report should include all projects or only a selected one.
-
Group By: By default, reports display a summary per user. However, enabling grouping allows further breakdown of data by: Project, Epic, and other Jira Custom Fields.
-
Generating the Report
Once all parameters are configured, click the Create button. The system will generate a report based on the selected criteria, presenting insights into workload and utilization trends.
-
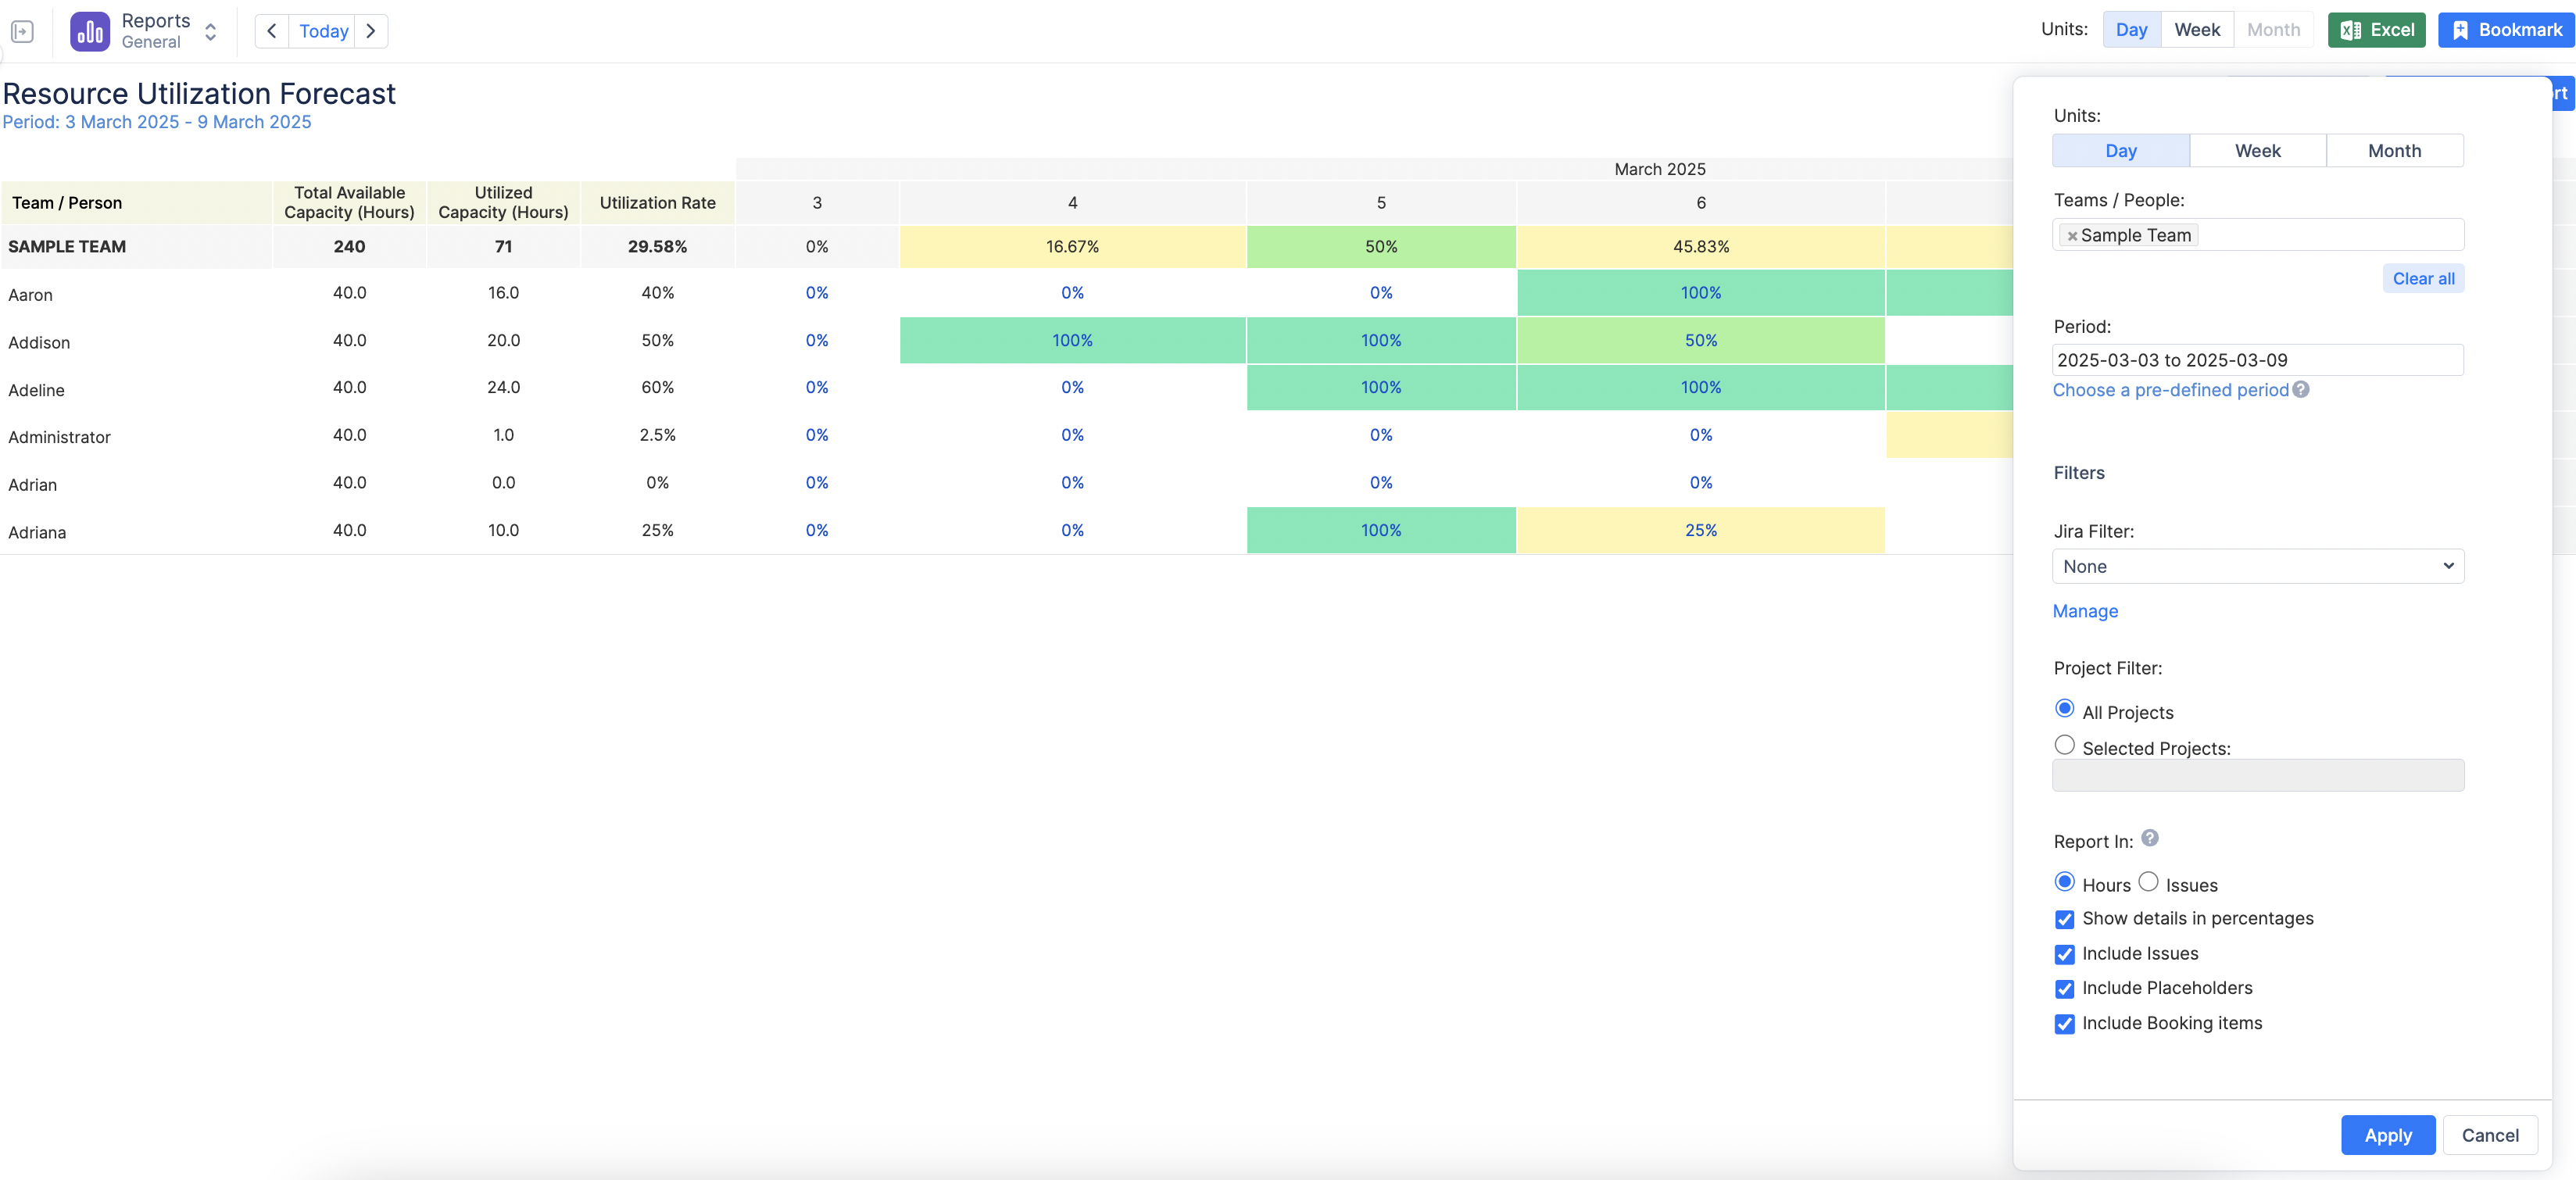
Customizing the Report After Creation
Once the report is generated, you can further refine and adjust it dynamically by clicking on the
![]()
-
Change Display Units: Choose whether to view data by Day, Week, or Month for better visualization.
-
Modify the Team: Adjust the team selection if needed.
-
Edit the Period: Change the reporting period or use the Custom Period option to define a specific timeframe.
-
Apply Filters: Modify Jira filters or project filters as needed.
-
Enable ‘Show Details in Percentage’: Toggle this option to display utilization details in percentage format or in hours/days.
-
Select Data Sources: Choose whether the report should include: Jira Issues, Placeholders, or Bookings.
-
After making adjustments, click Apply to refresh the report with updated settings in real-time.
-
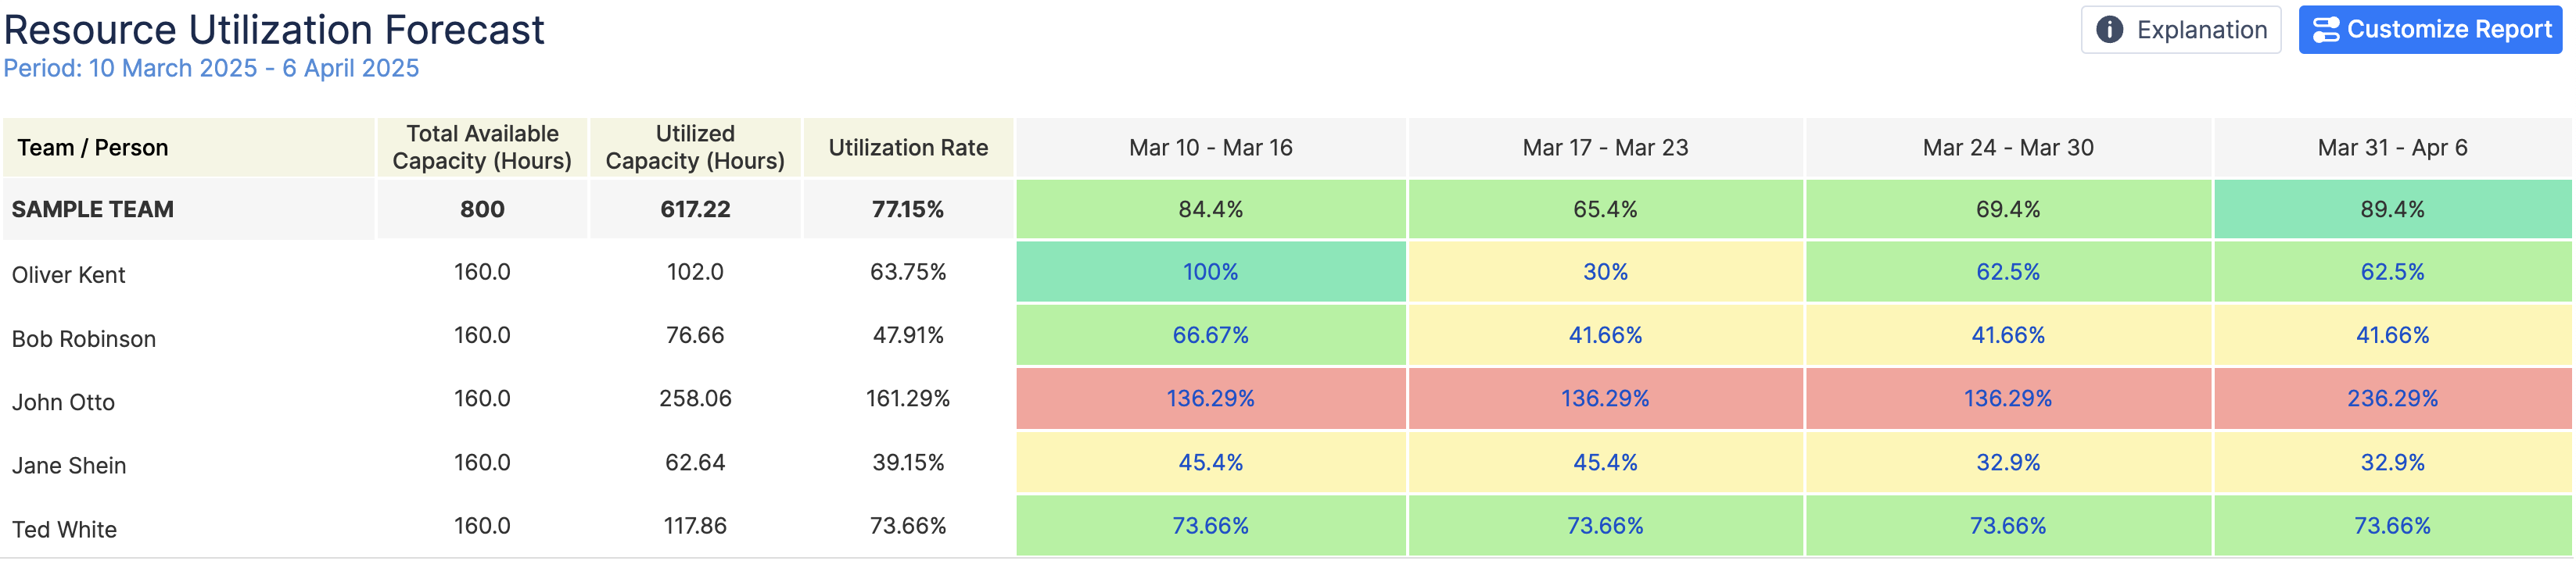
Understanding the Report Outcome
The generated report provides a structured overview of resource utilization:
-
Records of teams and team members appear on the left: Each row represents a team or an individual.
-
Columns correspond to the selected unit (Day, Week, or Month): Each column displays data for the corresponding time unit.
-
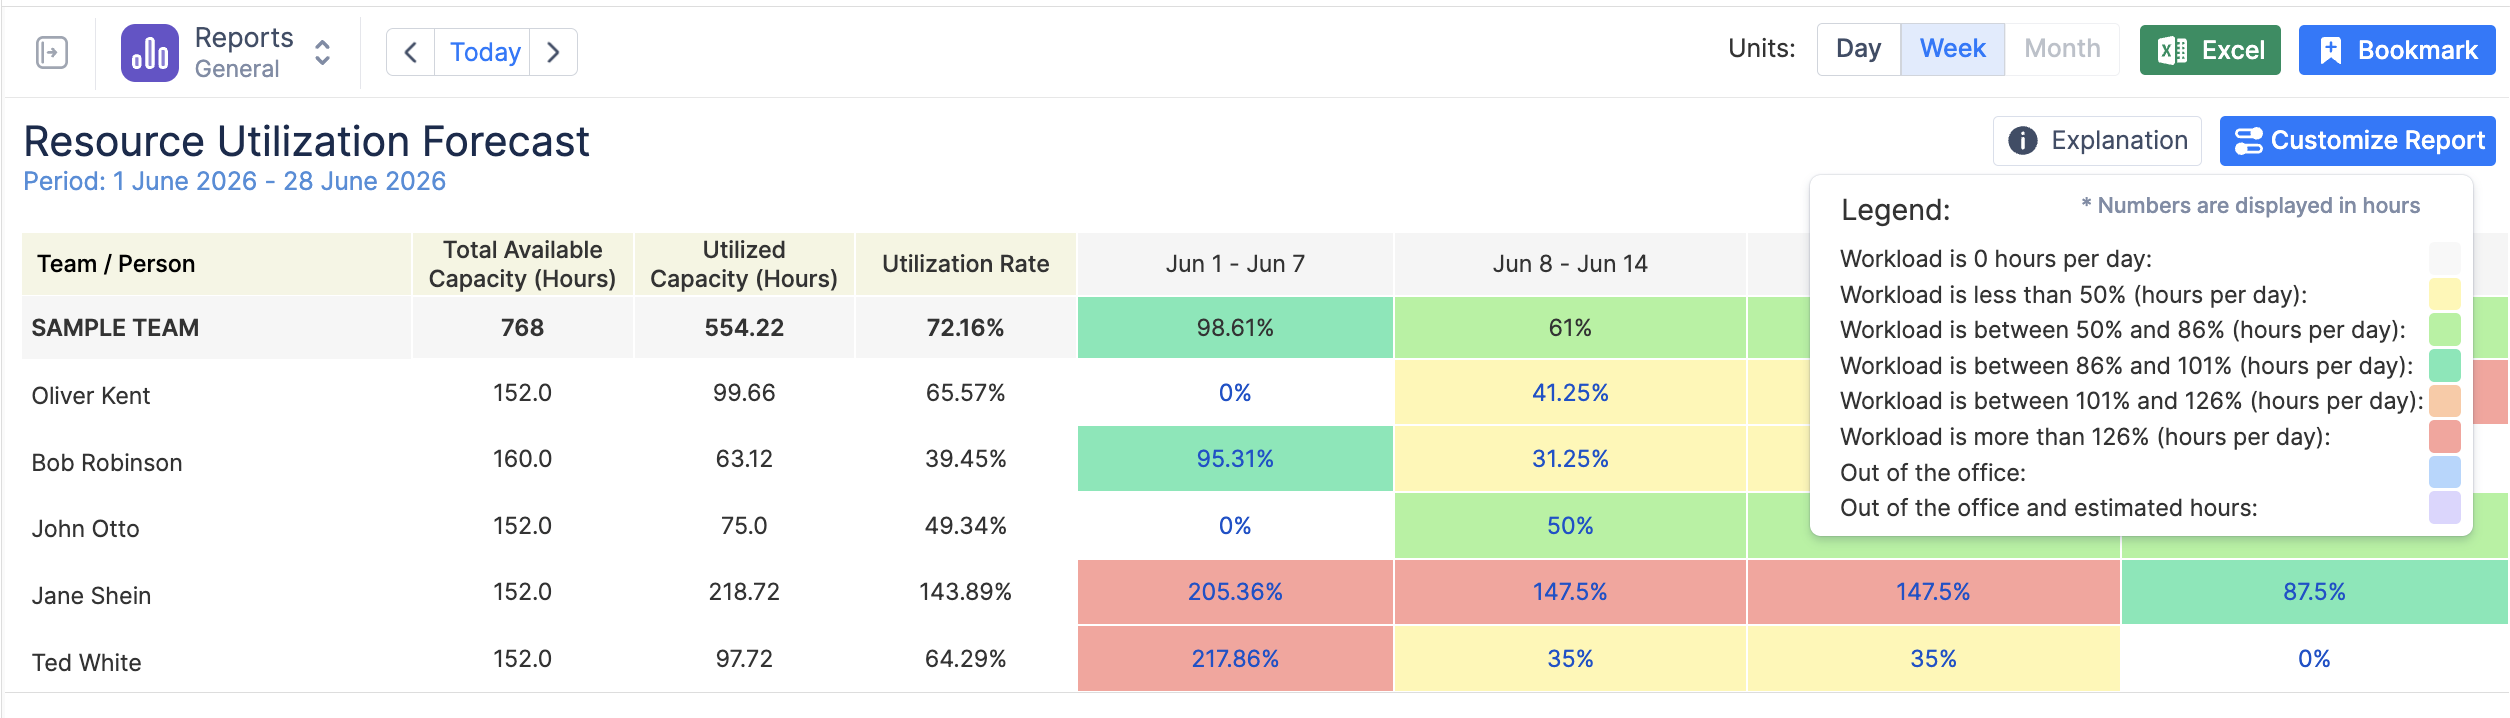
Utilization Data: The numbers in the table indicate the number of hours of scheduled work for each person or the percentage of their total capacity that is utilized.
-
A color-coded visualization helps identify workload distribution.
If the option 'Users log worked time' is activated in General Configurations, this report will exclusively display data for the present and future, as historical information is captured in worklogs (Time spent).
If you're estimating tasks with Story Points or Daily Estimate, make sure to select the 'Users do not log worked time' option. This is important because Story Points represent the effort needed for a task and don't change over time, unlike hours. So, even if you log time, your Story Points will stay the same and need to be spread out over the task's duration. The same applies to Daily Estimate. In this case, the report will show data for the past and for the future.
For a more comprehensive overview, you may refer to the video guide: