
Team Utilization Forecast provides a comprehensive overview of how different teams’ available capacity is allocated across various projects, initiatives, or epics over a specific period.

A key advantage of this report is that it includes data directly from the Team Panel, ensuring accurate and up-to-date insights into team workload and resource distribution.
Report Overview
Here’s a breakdown of what this report covers:
-
Team-Level Utilization:
-
The report shows how each team’s total available capacity (in hours) is being utilized. It breaks down the workload by teams and projects, giving a clear view of how resources are distributed.
-
Utilized Capacity and Utilization Rate:
-
Total Available Capacity: The total hours that the team has available to work, taking into account their full capacity minus any time off (like vacations or sick leave).
-
Utilized Capacity: The number of hours that have been allocated to tasks or events for each team, broken down by project.
-
Utilization Rate: The percentage of the team’s available hours that are utilized by scheduled tasks and events.
-
Week-by-Week Breakdown:
-
The report is broken down into daily, weekly, or monthly sections, showing how many hours each team is scheduled to work on different projects during the upcoming weeks. This helps to visualize potential under- or over-utilization over time.
-
Project-Specific Detail:
-
You can see the detailed distribution of workload across various projects within each team. The report lists each project the team is working on, along with the number of hours allocated to it.
-
Level of Granularity: This report can be adjusted to different levels of detail such as Project, Initiative, or Epic Detailed.
-
Customization Options:
-
You can filter by specific teams, projects, and time periods, allowing for flexibility in analyzing the data. The report also includes options to:
-
Include Issues: Show hours allocated to Jira tasks (Based on the remaining estimates of scheduled tasks)
-
Include Placeholders: Consider any placeholder tasks that may be scheduled for the team.
-
Include Booking Items: Incorporate booked events into the utilization calculations.
Report Generation
-
Selecting the Reporting Criteria
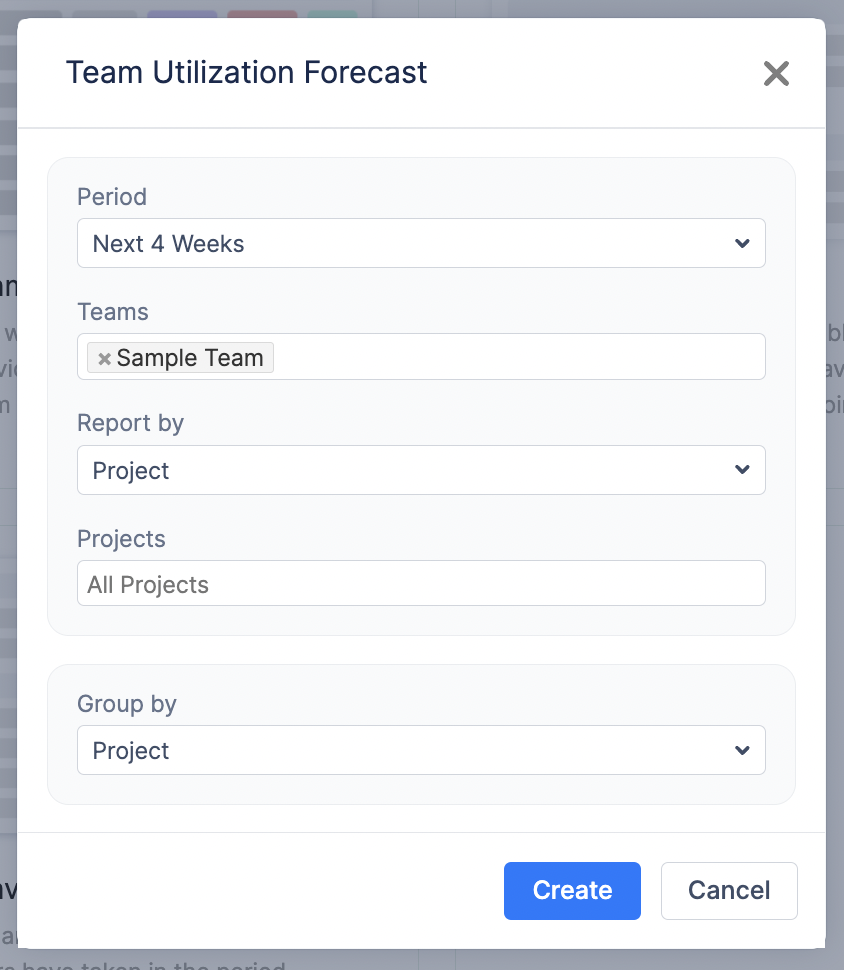
To generate a report, configure the following parameters:
-
Period: Choose the time frame for the report from a predefined list (e.g., Next 4 Weeks, Next Month, etc.).
-
Teams / People: Select the team or individual for whom the report should be generated.
-
Report By: Defines the data source of the report. By default, the report includes all scheduled activities for the selected user or team, but you can filter the data by: Project, Initiative, Epic.
-
Projects: If “Project” is selected in the “Report By” field, specify whether the report should include all projects or only a selected one.
-
Group By: Enabling grouping allows further breakdown of data by: Project, Epic, and other Jira Custom Fields.
-
Generating the Report
Once all parameters are configured, click the Create button. The system will generate a report based on the selected criteria, presenting insights into workload and utilization trends.
-
Customizing the Report After Creation
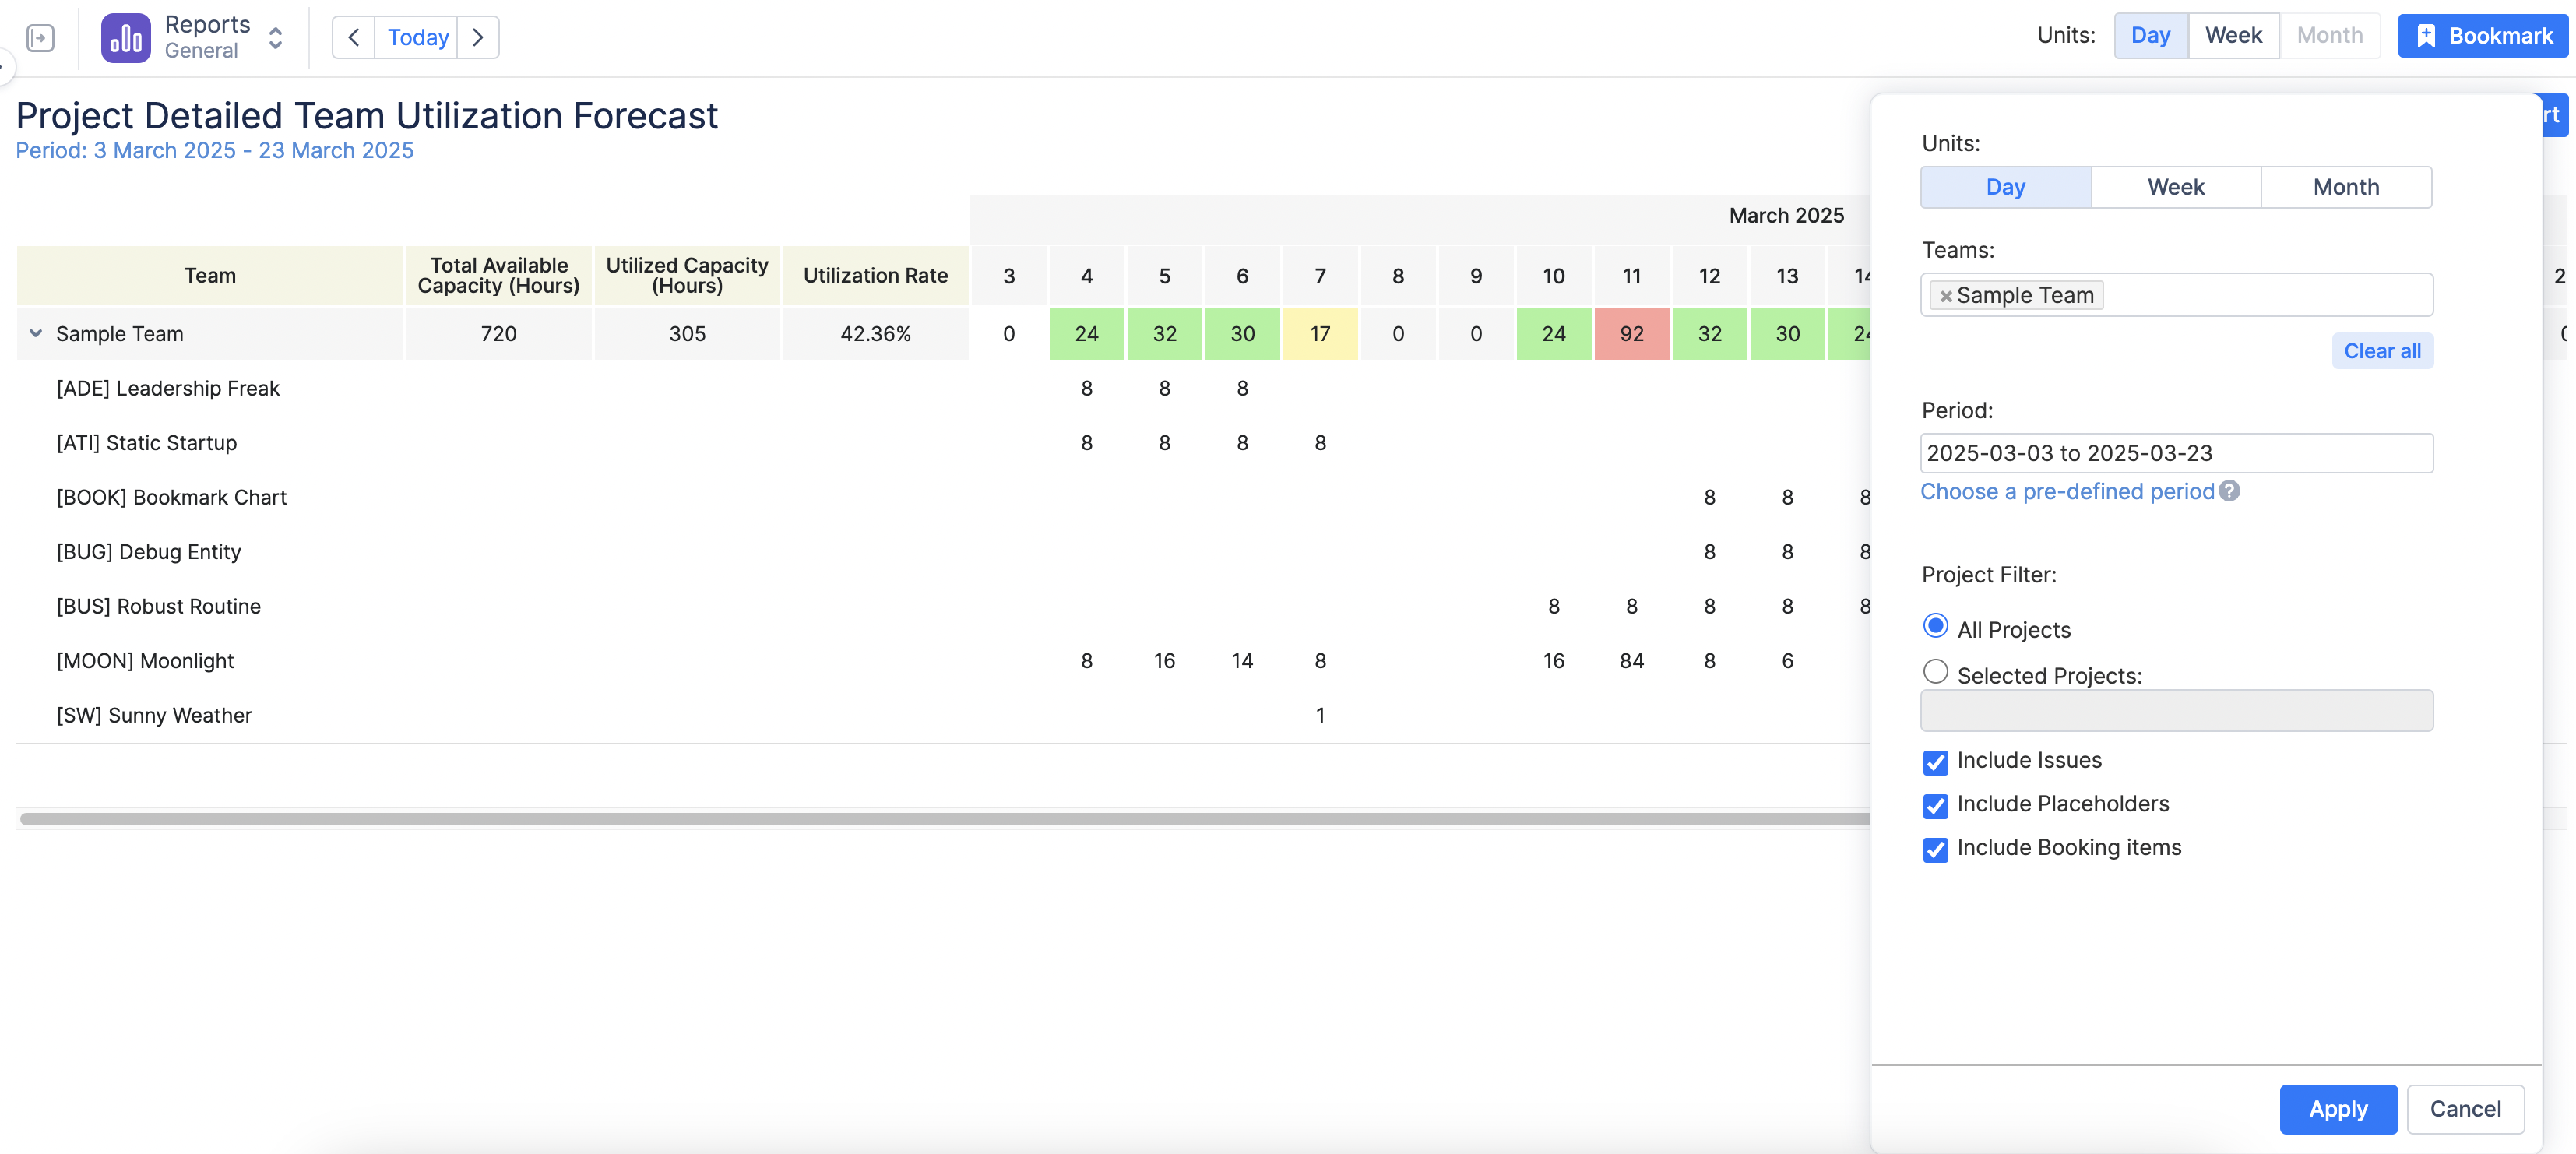
Once the report is generated, you can further refine and adjust it dynamically by clicking on the
![]()
-
Change Display Units: Choose whether to view data by Day, Week, or Month for better visualization.
-
Modify the Team: Adjust the team selection if needed.
-
Edit the Period: Change the reporting period or use the Custom Period option to define a specific timeframe.
-
Apply Filters: Modify filters as needed.
-
Select Data Sources: Choose whether the report should include: Jira Issues, Placeholders, or Bookings.
-
After making adjustments, click Apply to refresh the report with updated settings in real-time.
-
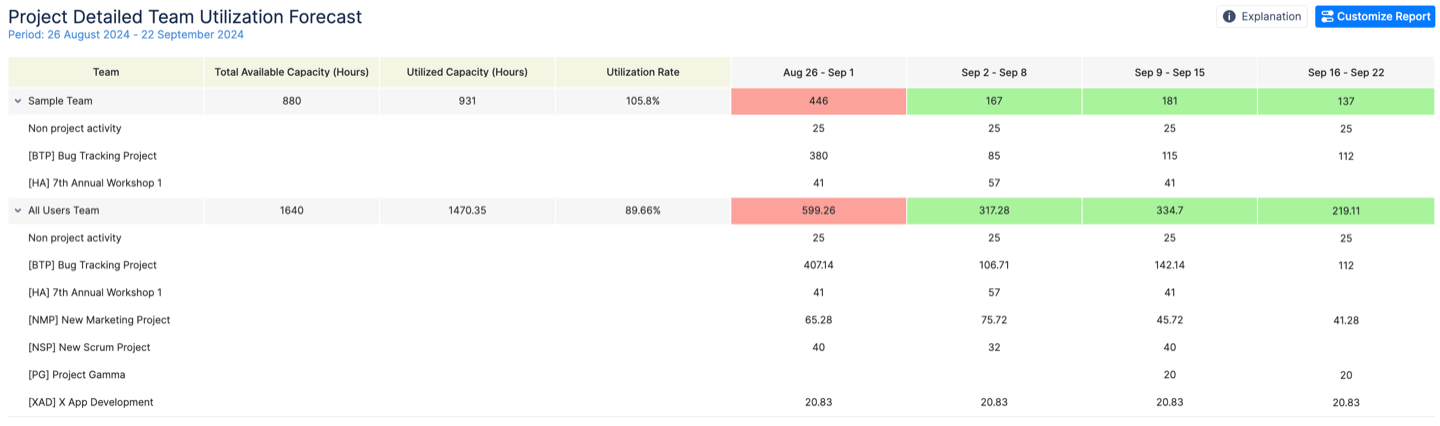
Understanding the Report Outcome
-
The top row for each team aggregates the total capacity, utilized hours, and utilization rate for the reporting period.
-
Projects and non-project activities under each team display detailed breakdowns of hours allocated across different weeks.
-
If the utilization rate exceeds 100%, it indicates an overbooked team that may require workload redistribution.
If the option 'Users log worked time' is activated in General Configurations, this report will exclusively display data for the present and future, as historical information is captured in worklogs (Time spent).
If you're estimating tasks with Story Points or Daily Estimate, make sure to select the 'Users do not log worked time' option. This is important because Story Points represent the effort needed for a task and don't change over time, unlike hours. So, even if you log time, your Story Points will stay the same and need to be spread out over the task's duration. The same applies to Daily Estimate. In this case report will show data for past and for future.