
Team Utilization Pie Chart provides a visual representation of how a team’s time is distributed across different projects. It offers insights into both past and future utilization, helping managers analyze historical workload allocation and forecast upcoming resource distribution.
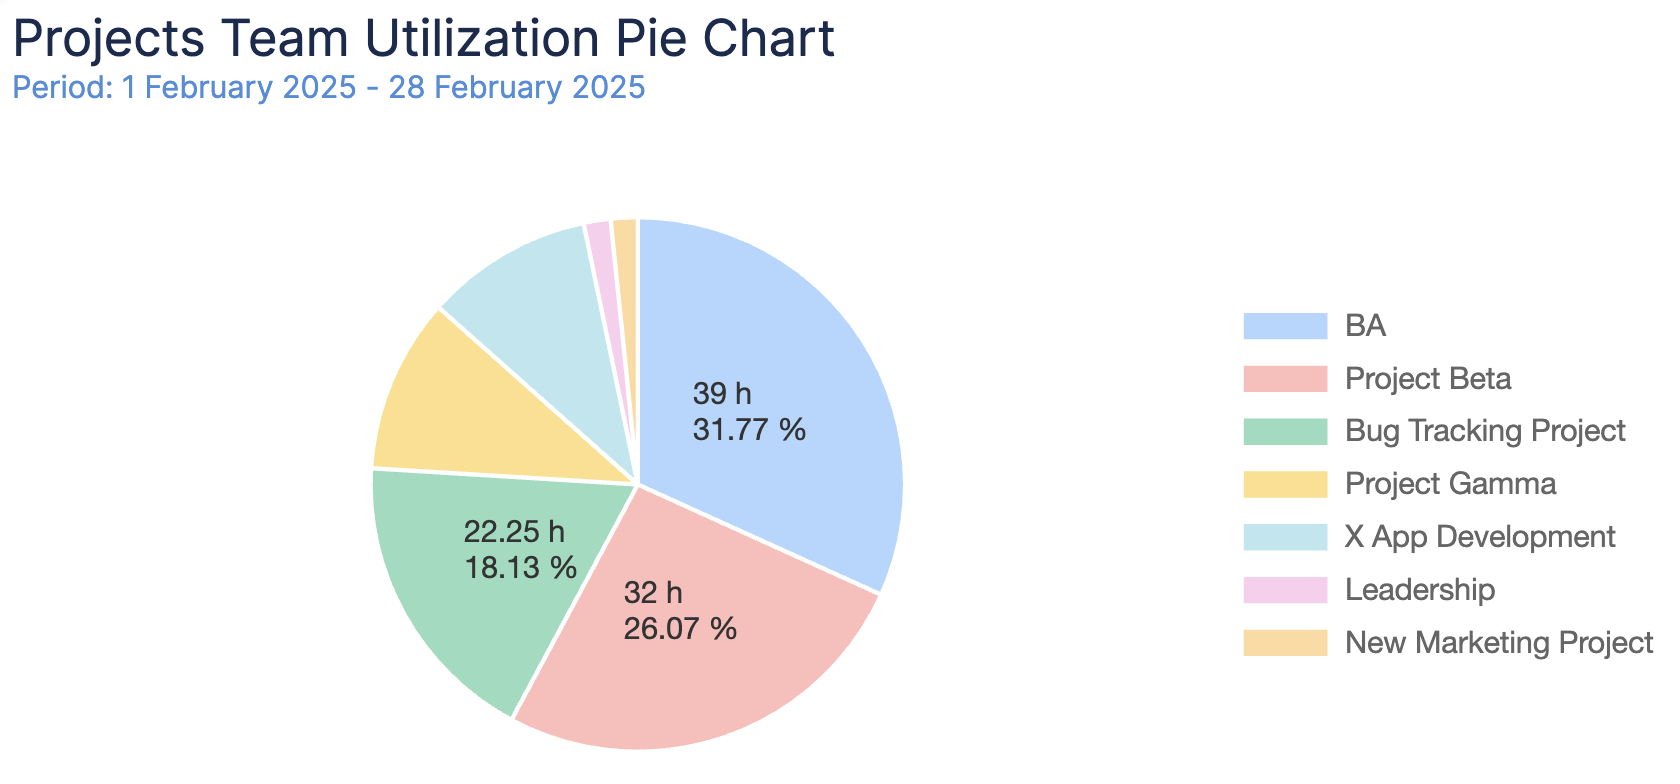
Chart Overview
Here’s what it does:
-
Past Utilization: Based on logged work hours, bookings & imported calendar events, this view showcases how the team's time was distributed across different projects in a completed period.
-
Future Utilization: Derived from estimates, bookings, placeholders & imported calendar events this perspective predicts how the team's time will be allocated in an upcoming period.
-
Data Sources: The Team Utilization Pie Chart aggregates data from:
-
Jira Tasks: Utilization based on remaining estimates, story points, or logged work.
-
Bookings & Placeholders: Includes planned work and temporary allocations.
-
Calendar Events: Accounts for external schedules affecting availability.
-
Worklogs: When generated for the past.
-
Workload Calculation
-
Total Allocated Time: The sum of all assigned workload across projects.
-
Project-Based Utilization: Displays the time distribution per project as hours and percentages.
-
Workload Distribution: Provides an overview of how time is spread across multiple projects to identify focus areas.
-
Future Utilization Trends: The report enables analysis of:
-
How the team’s time is expected to be allocated in the upcoming period.
-
If the workload distribution aligns with business priorities.
Report Generation
-
Selecting the Reporting Criteria
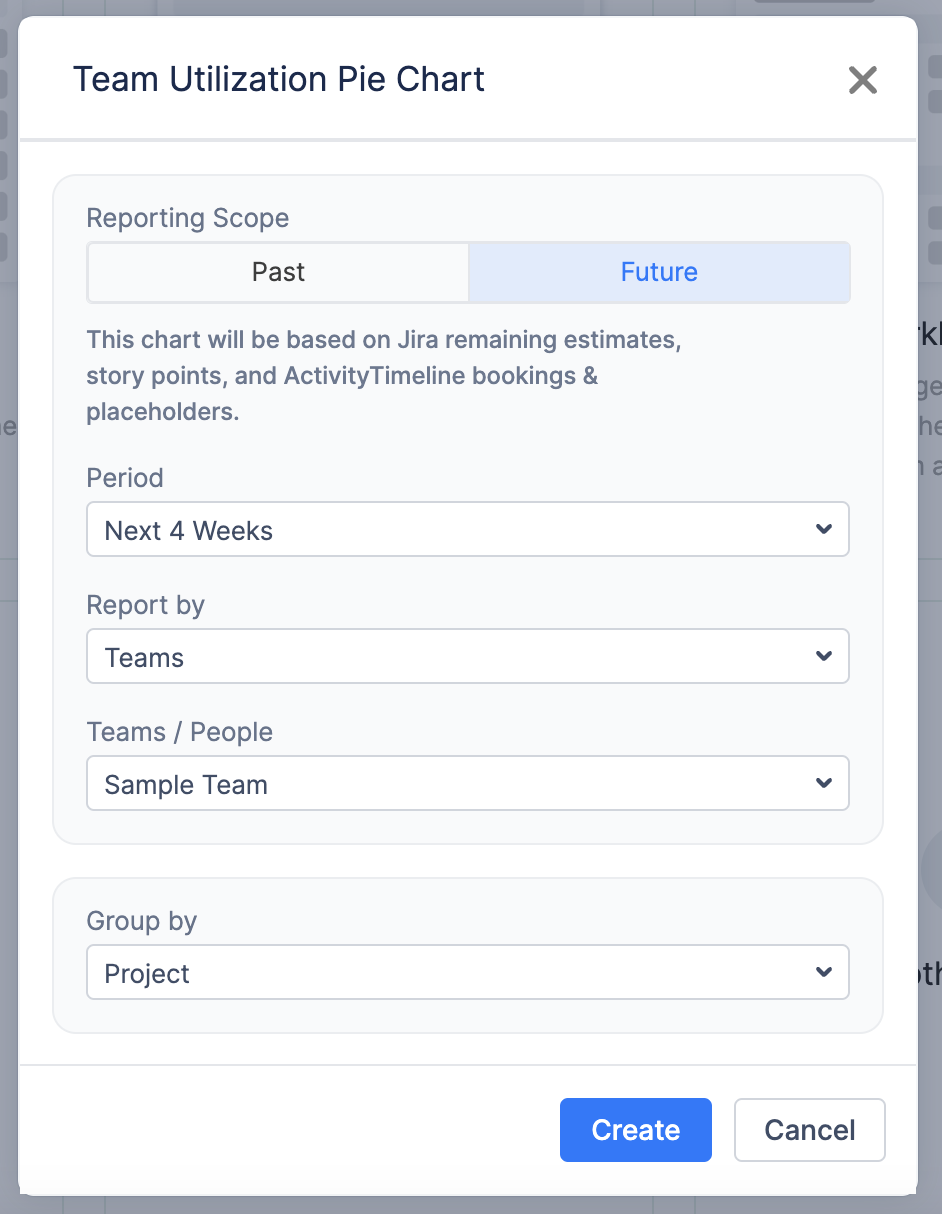
To generate the Team Utilization Pie Chart, configure the following parameters:
-
Reporting Scope: Choose whether to analyze past (worklogs) or future (estimates & bookings).
-
Period: Choose the time frame for the report from a predefined list (e.g., Next 10 Weeks)
-
Report By: Defines the data source of the chart. By default, the report includes all scheduled activities for the selected user or team but you have an option also to generate it for the set of data using Jira filter.
-
Teams / People: Select the team for whom the report should be generated.
-
Jira Filter: If “Jira Filter” is selected in the “Report By” field, specify which filter should be used to generate chart.
-
Group By: Organize data by Project, Epic, or Jira Custom Fields.
-
Generating the Report
Once all parameters are configured, click the Create button. The system will generate a chart with will display a pie chart with a proportional breakdown of time allocation.
-
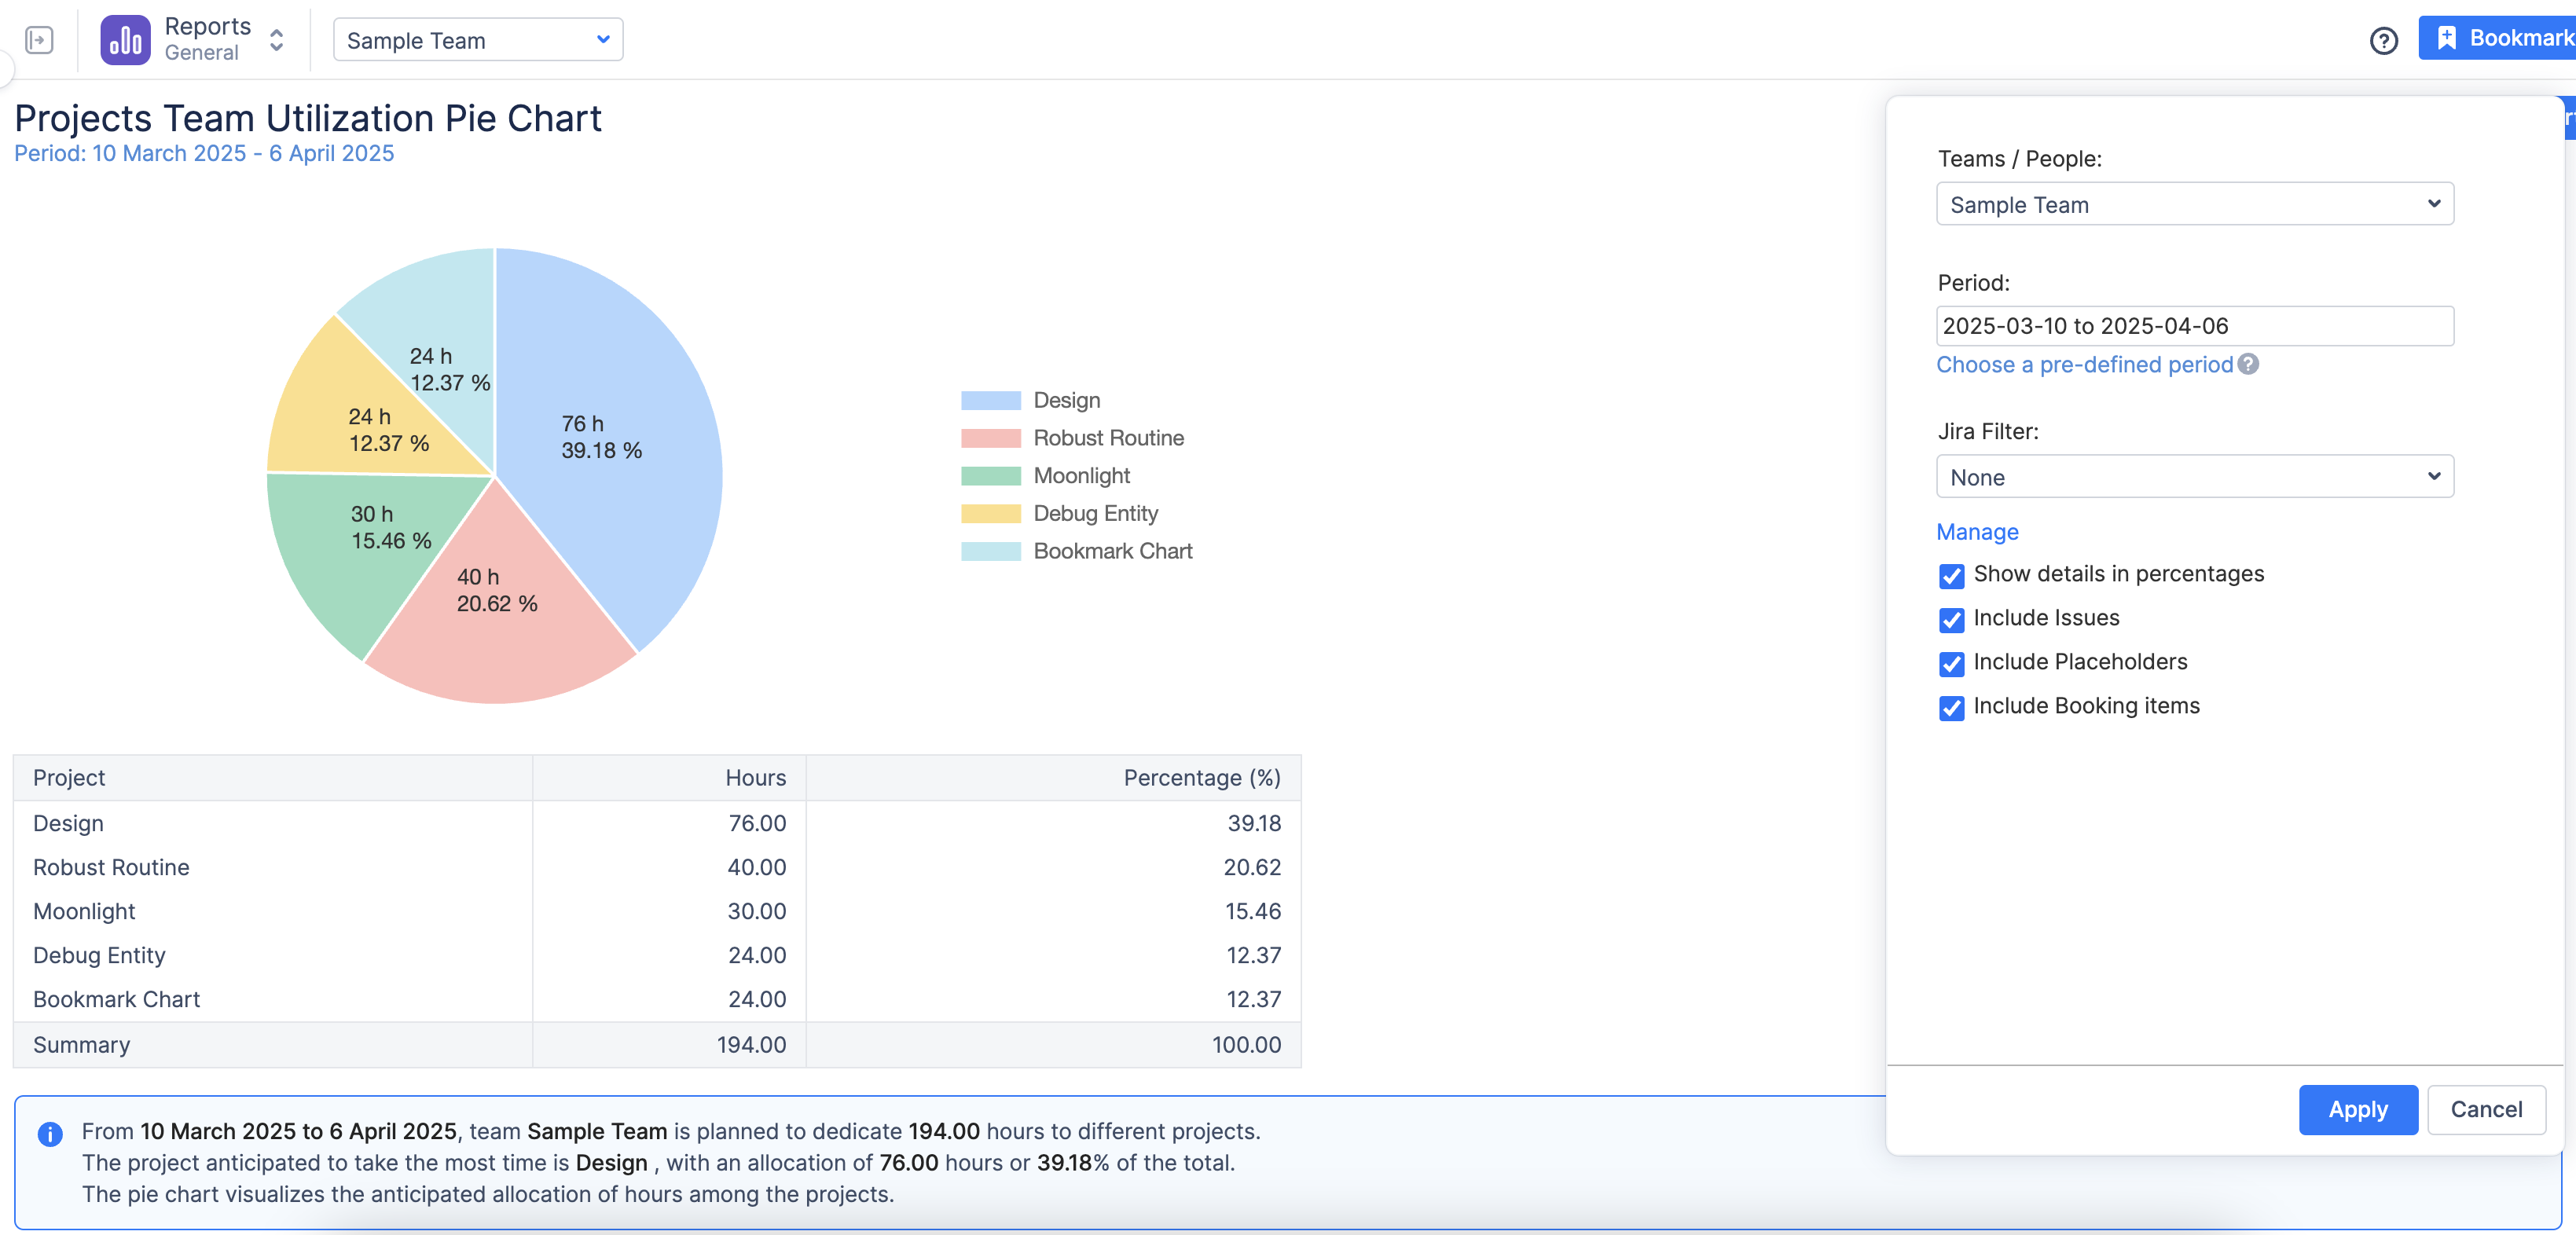
Customizing the Report After Creation
After generating the report, users can dynamically adjust it using the

-
Change Team Selection: Refine the selected team or individuals.
-
Adjust Time Period: Change or extend the reporting period.
-
Update Grouping & Filters:
-
Modify or add Jira filters.
-
Enable/disable Jira Issues, Bookings, or Placeholders.
-
-
Toggle Percentage View: Choose to display time allocation as percentages.
After making changes, click
-
Understanding the Chart Outcome
The chart provides a breakdown of future or past utilization trends, helping teams:
-
The pie chart provides an easy-to-understand breakdown of how team hours are allocated across different projects or other entities, helping managers quickly identify workload distribution.
-
The ability to generate reports based on custom fields allows teams to analyze utilization from different perspectives. For example, by grouping data by issue type, teams can identify whether more time is spent on bug fixes, improvements, or new features, helping to assess historical trends and optimize planning strategies.
-
The smart legend at the bottom of the page helps you read the chart's trends and understand it better.

Example
For the reported period, this team is scheduled for 48 hours, from which exactly 50% will be spent on the Website project, making it by far the most important project of this team.
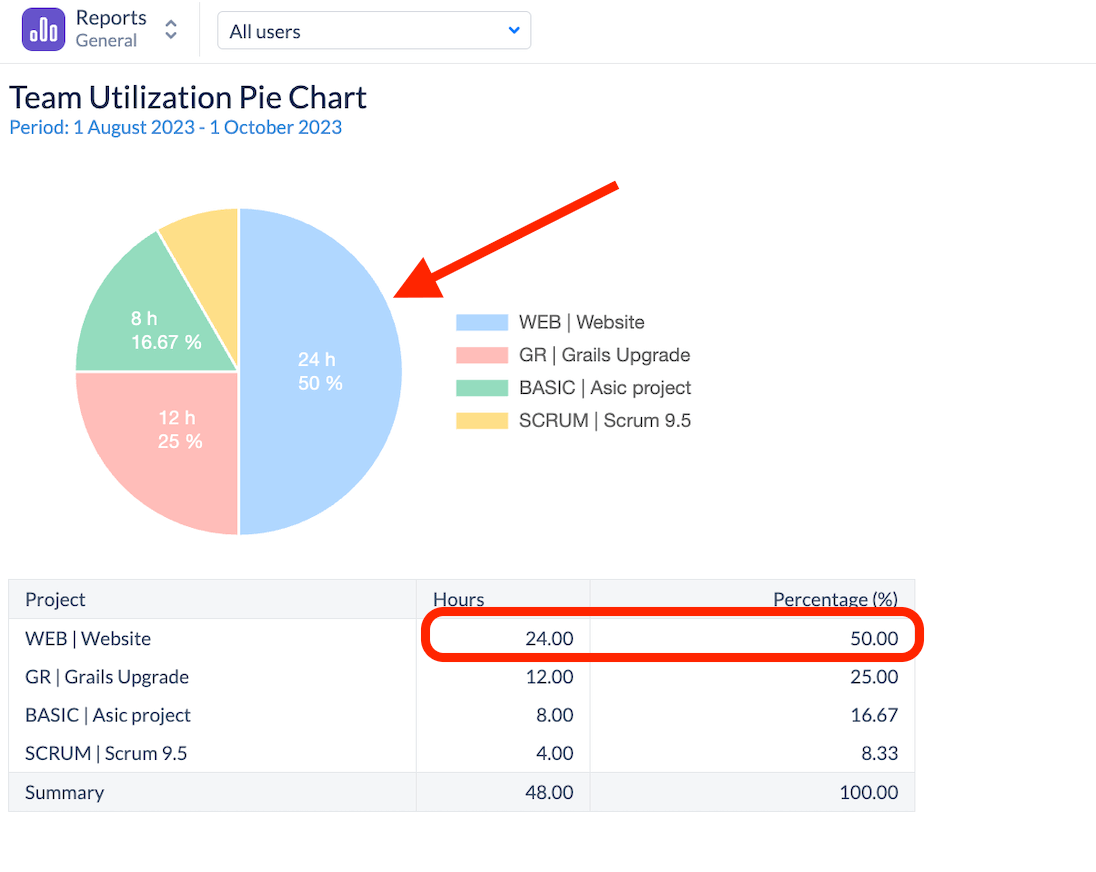
This chart will not show the efficiency of the team, but only its time distribution, to check this team’s utilization we recommend using the Planned vs Actual report by Team.