
This view is part of the Advanced Edition of ActivityTimeline Cloud.
Overview
The Alignment report in Timesheets allows you to compare Planned time vs Logged time over a selected period.
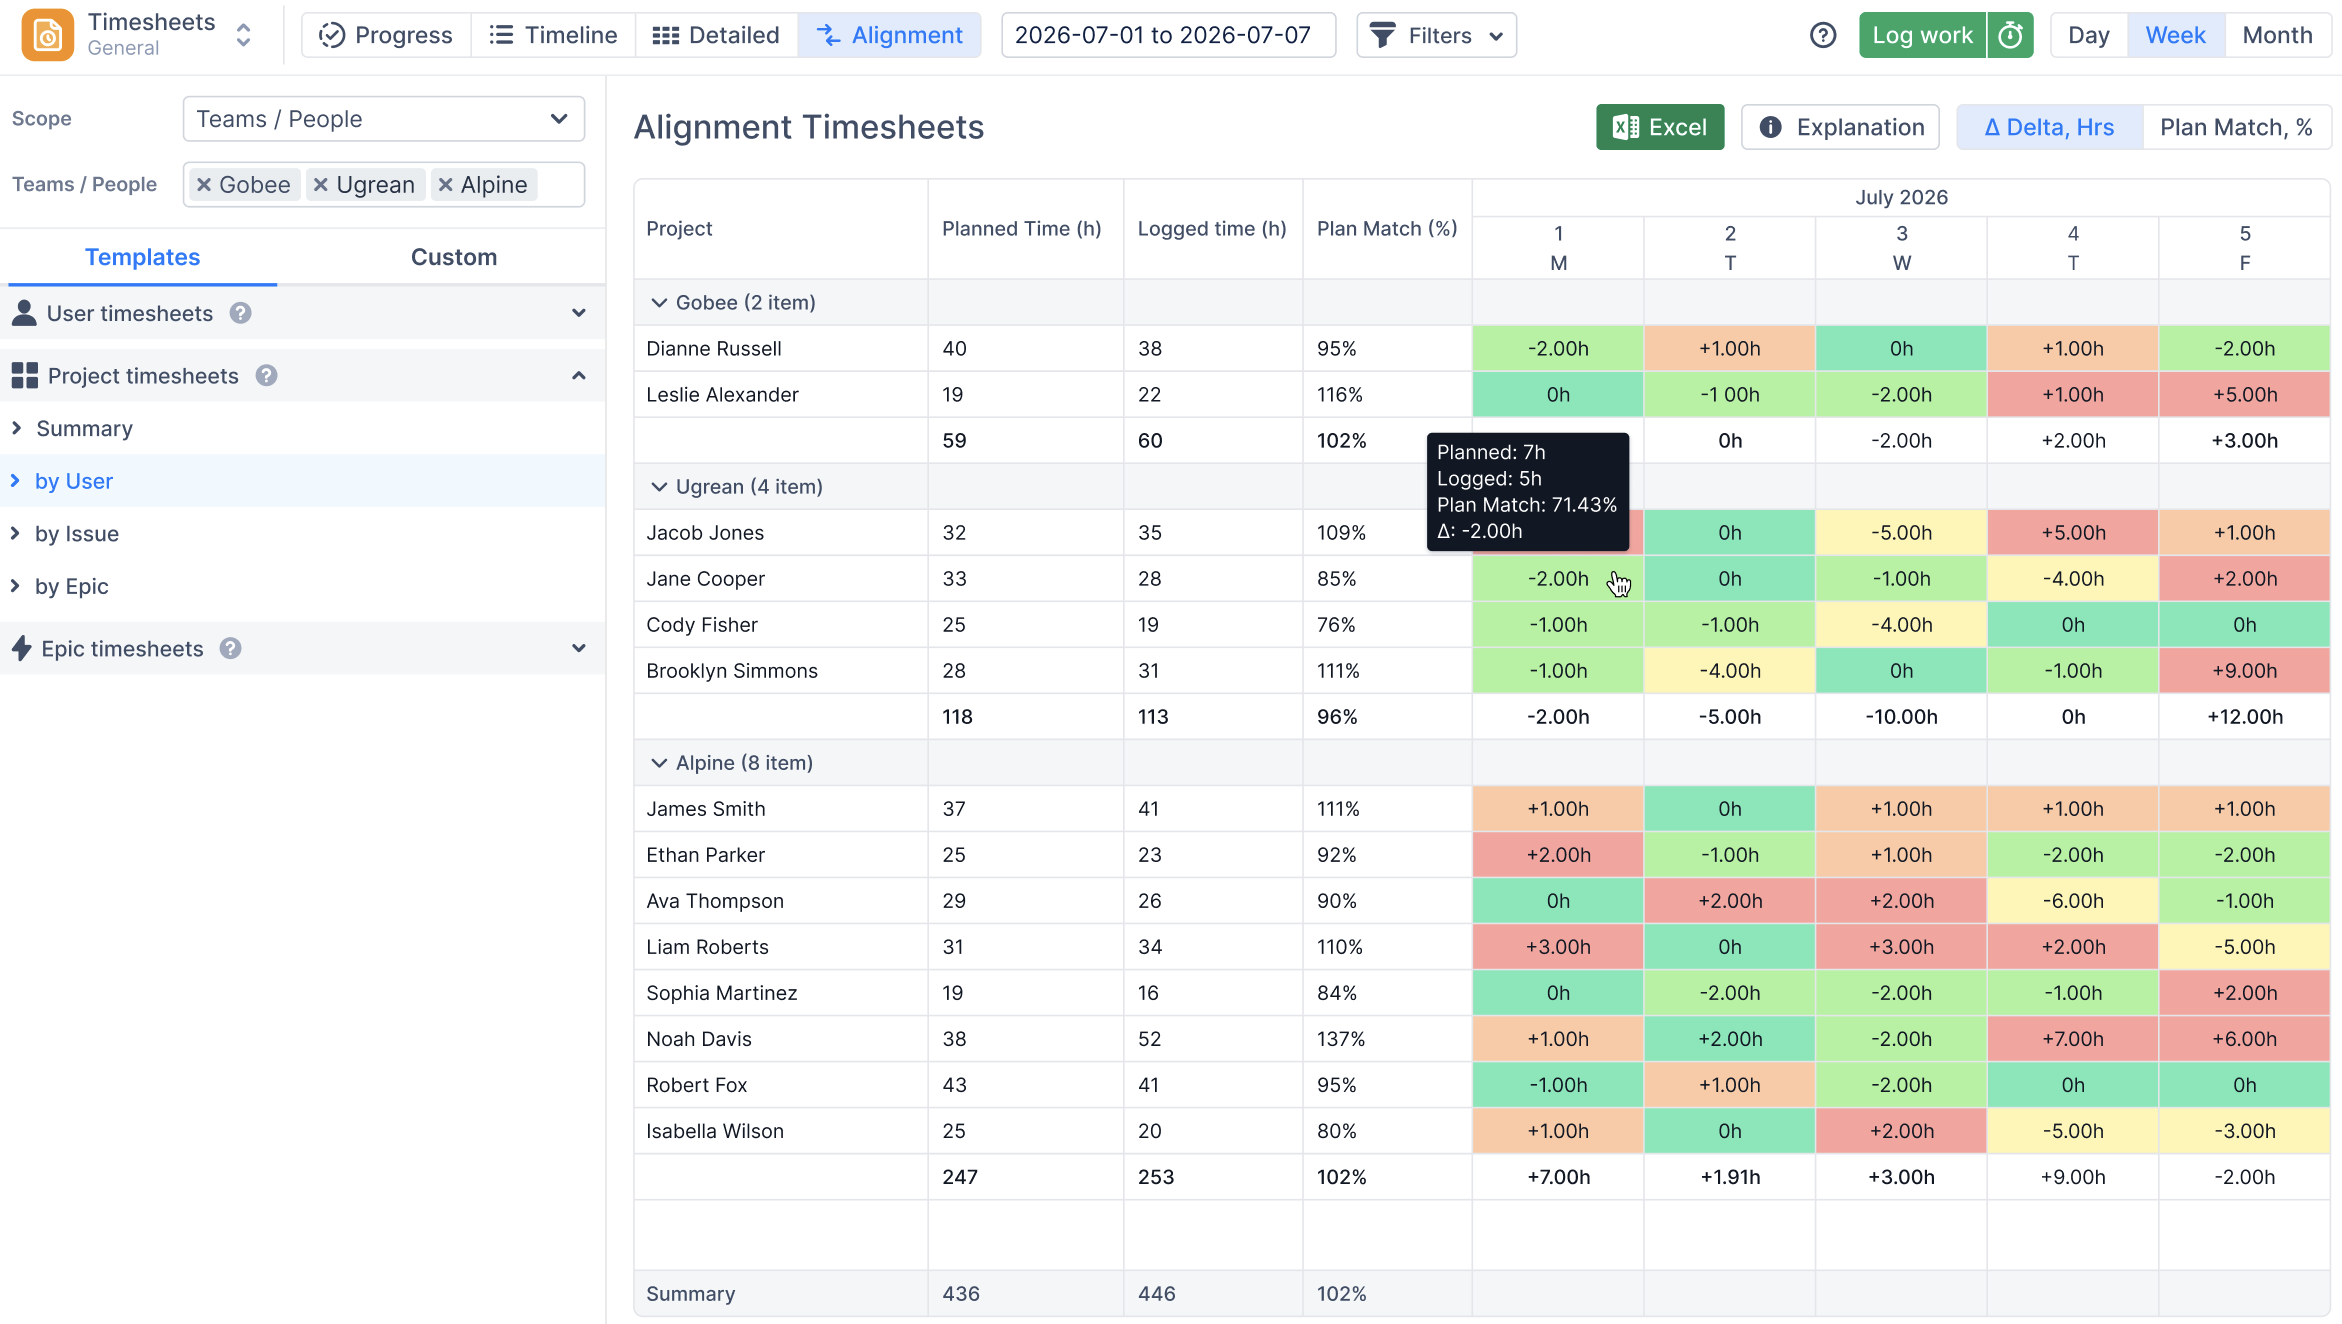
This report helps you understand how accurately the work was executed against the plan by showing:
-
How much time was planned
-
How much time was actually logged
-
the difference (Δ Delta, Hours)
-
the ratio between them (Plan Match, %)
It is useful for managers, team leads, and project managers who want to track whether work is being logged according to expectations.
Templates
The report follows the same template structure as Timeline Timesheets.
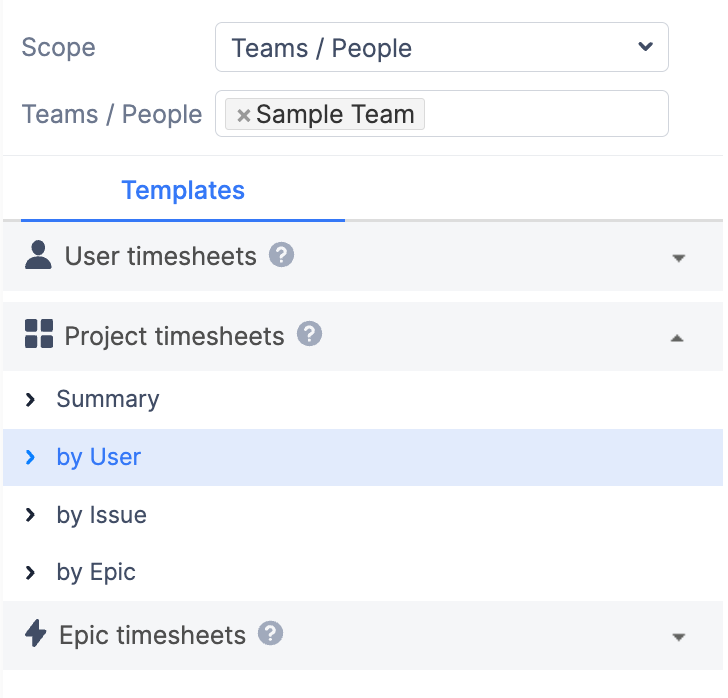
User Timesheets
-
Summary
-
By Project
-
By Issue
-
By Epic
Project Timesheets
-
Summary
-
By User
-
By Issue
-
By Epic
Epic Timesheets
-
Summary
-
By User
-
By Issue
By default, the report opens in:
User Timesheets → Summary
How the Report Works
The report compares Planned time and Logged time for each row and selected period.
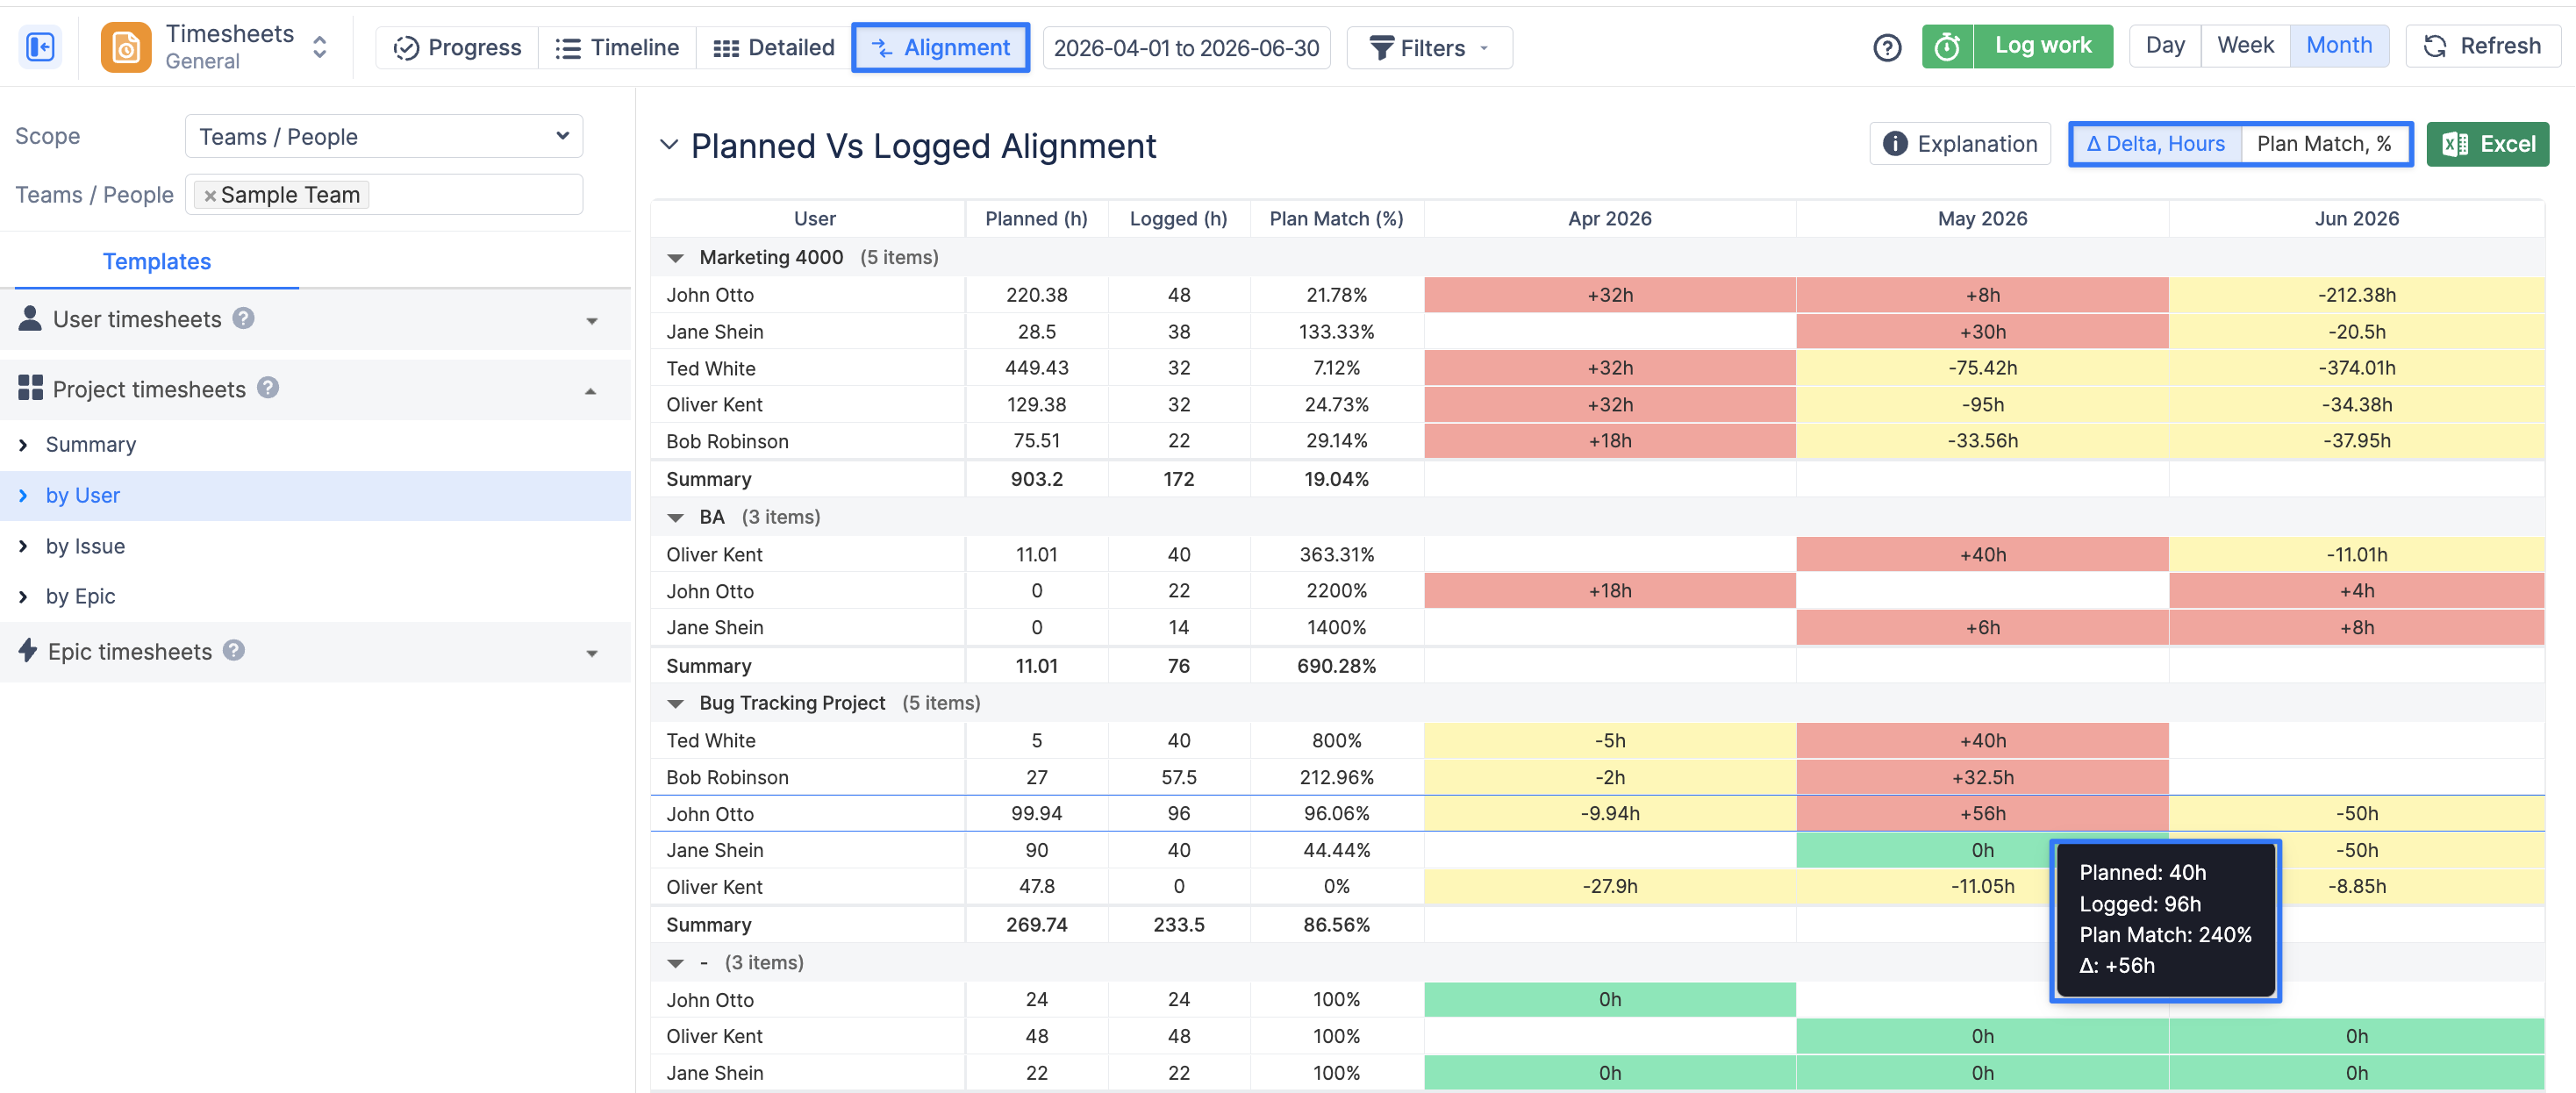
Planned Time
Planned time is calculated from:
-
Jira issue Original Estimate
-
Bookings
-
Placeholders
The calculation follows the same logic used in Planner.
Logged Time
Logged time is calculated from Jira worklogs.
Optionally:
-
Bookings or Calendar events can be treated as logged time if this setting is enabled: ActivityTimeline Configuration-> Timesheets Configuration.

Key Metrics
Δ Delta, Hours
Delta shows the difference between logged and planned time.
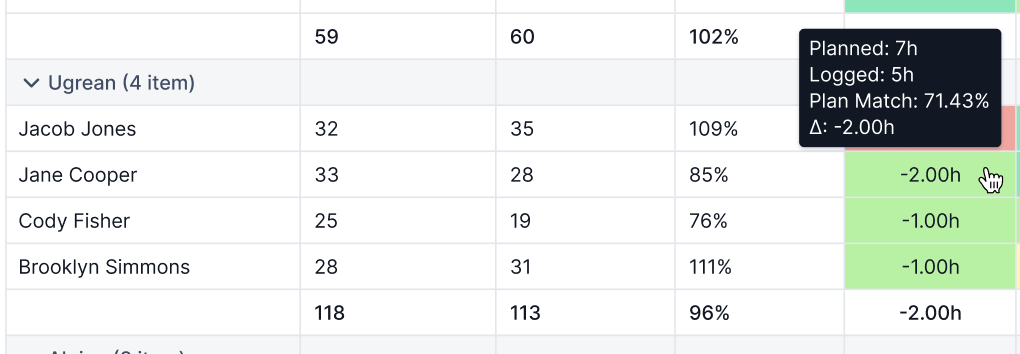
Formula:
Δ = Logged time - Planned time
Examples:
-
Planned 40h, Logged 45h → +5h
-
Planned 40h, Logged 38h → -2h
-
Planned 40h, Logged 40h → 0h
Interpretation:
-
Positive (+) → More time logged than planned
-
Negative (-) → Less time logged than planned
Plan Match, %
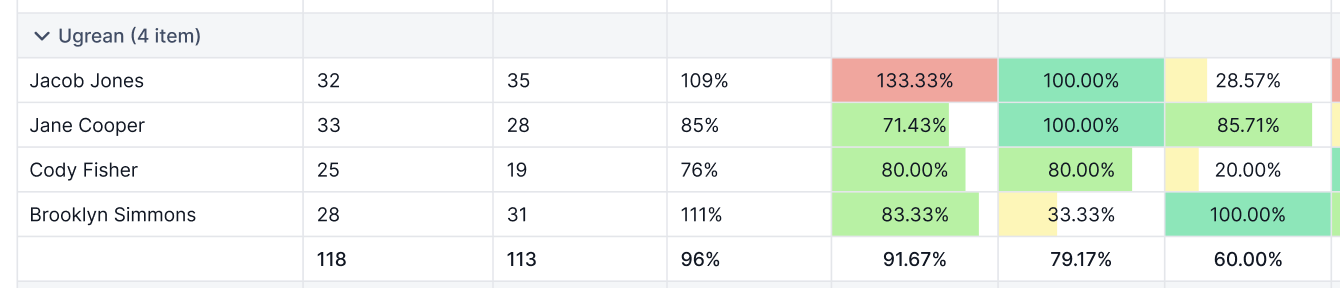
Plan Match shows the ratio between logged time and planned time.
Formula:
Plan Match (%) = (Logged time / Planned time) × 100
Examples:
-
Planned 40h, Logged 40h → 100%
-
Planned 40h, Logged 20h → 50%
-
Planned 40h, Logged 80h → 200%
Interpretation:
-
100%: Logged time exactly matches planned time.
-
Above 100%: More time was logged than planned.
-
Below 100%: Less time was logged than planned.
Plan Match is a comparison ratio, not a performance score.
Display Modes
The report provides two display modes.

1. Δ Delta, Hours (default)
-
Time buckets display the difference between planned and logged time in hours, for example:
-
+5h -
-2h -
0h
-
2. Plan Match, %
-
Time buckets show percentage values
-
Cells may include a progress-style fill
Color Coding
Cells are colored based on Plan Match (%), regardless of the selected display mode.
The current ranges are:
-
Below 50% → Yellow
-
50%–86% → Light green
-
87%–101% → Green
-
101%–125% → Light red / orange
-
Above 125% → Red
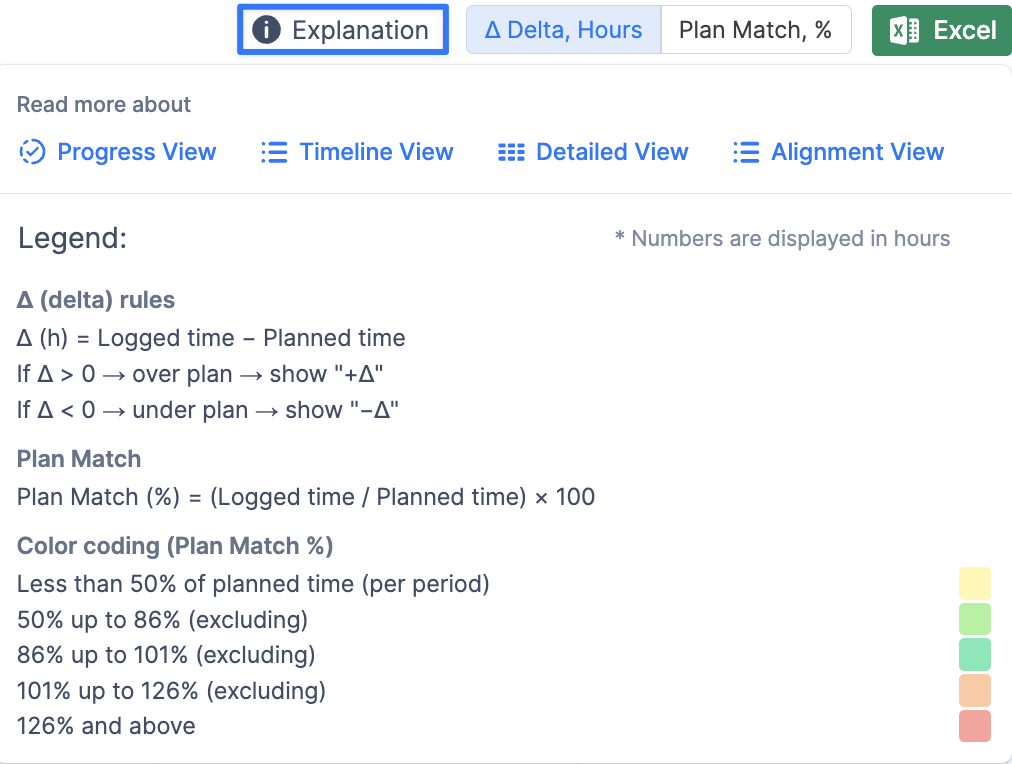
Color coding helps you quickly identify significant differences between planned and logged time.
How Non-Working Time Affects the Report
The Alignment Report compares Planned time with Logged time.
It does not automatically adjust the comparison based on:
-
Days off.
-
Holidays.
-
Weekends.
For example:
-
Planned: 40h
-
Logged: 24h
Result:
-
Plan Match: 60%
-
Delta: -16h
If the user also had two days off during the period, those days do not automatically reduce the planned value used in this comparison.
Important Behavior: When the User Has No Capacity for the Entire Period
If a user has no capacity for the entire selected time bucket, for example because of a full day or full week off, planned time is treated as 0h for that period.
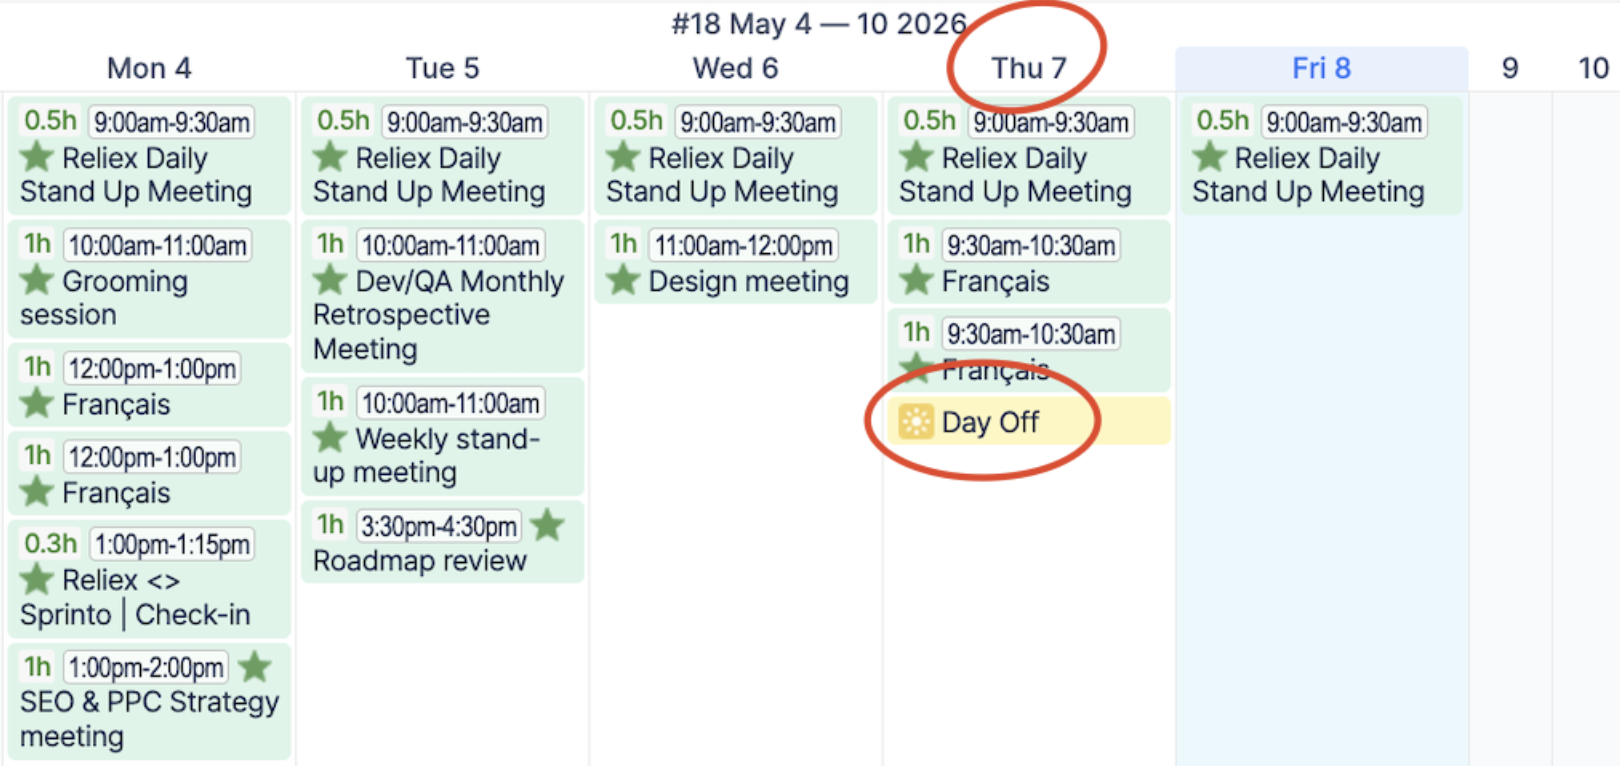
If time is still logged:
-
Planned: 0h
-
Logged: 8.5h
-
Delta: +8.5h
-
Plan Match: Not applicable
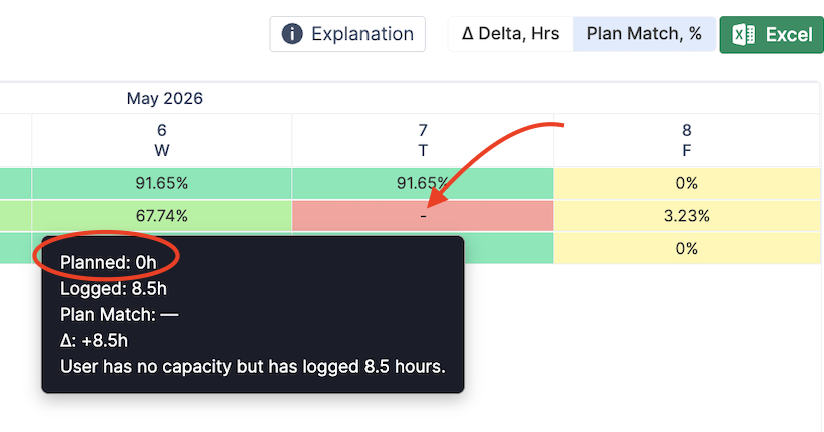
The logged time is therefore shown as time recorded without corresponding planned time.
Export to Excel
You can export the Alignment Report using the Excel button.
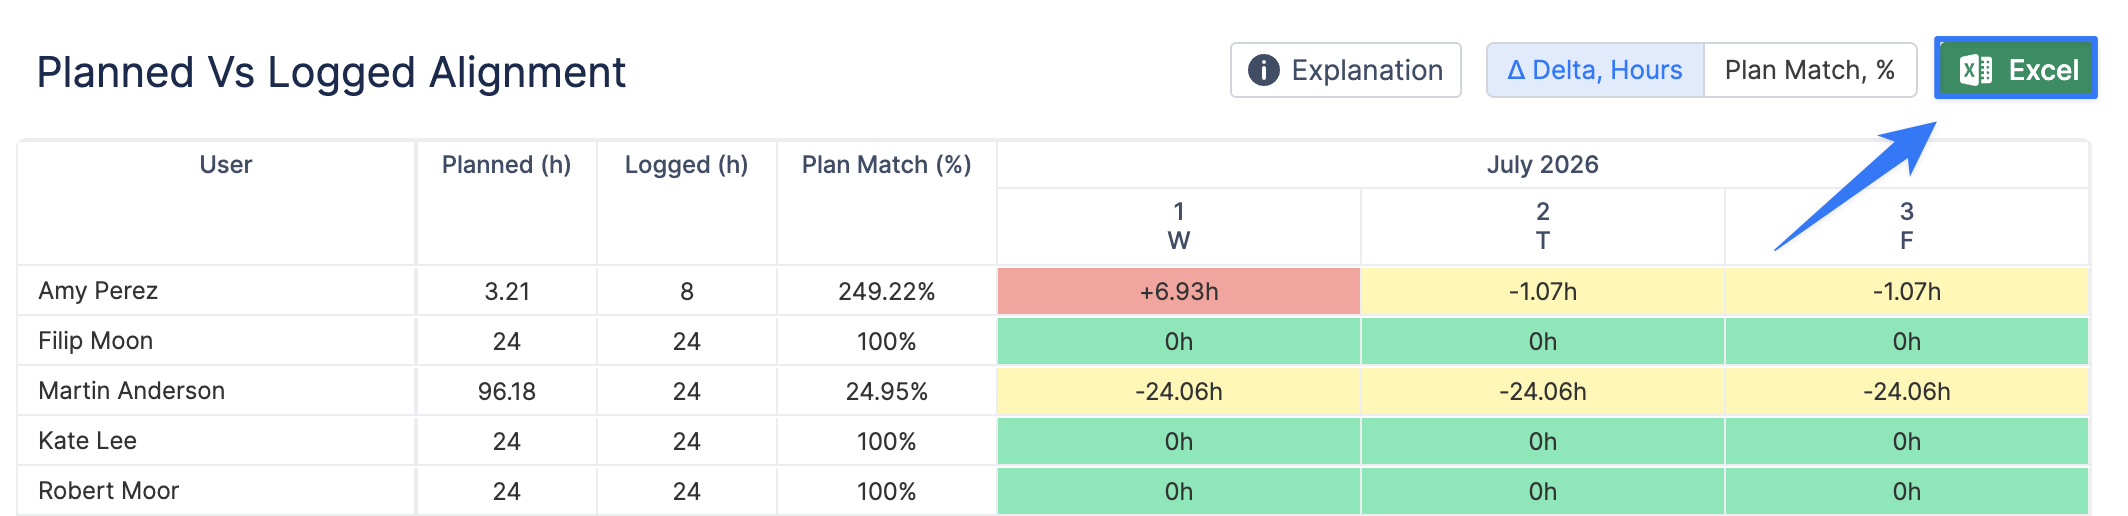
The export reflects the current report configuration, including:
-
Selected template.
-
Filters.
-
Grouping.
-
Time range.
FAQ
Why is Plan Match 200%?
Because more time was logged than planned.
Example: Planned 40h, Logged 80h → 200% (2× the planned effort).
Why is my Delta negative?
Because logged time is lower than planned time.
Example: Planned 40h, Logged 30h → Δ = -10h.
Does the Alignment Report account for holidays, days off, or weekends?
Not directly.
The report compares Planned time with Logged time and does not automatically reduce planned time because of non-working days within the period.
If a user has no capacity for the entire period, planned time is treated as 0h.
Why is the cell colored when I am viewing Delta?
Cell colors are always based on Plan Match (%), even when the report displays Delta values.
Are Plan Match percentages averaged across rows?
No.
ActivityTimeline:
-
Sums Planned time.
-
Sums Logged time.
-
Calculates Plan Match based on those totals.
This avoids misleading averages across rows.