
The Detailed Financial tab is your auditable ledger. It provides a comprehensive, line-by-line breakdown of every single transaction that contributes to your budget totals.
While the Summary and Budget vs Spend reports provide high-level aggregations, this report is designed for granular analysis. It allows you to audit exactly who logged time, when, and at what rate, as well as review every manual expense or revenue item you have recorded.
Understanding the Data Table
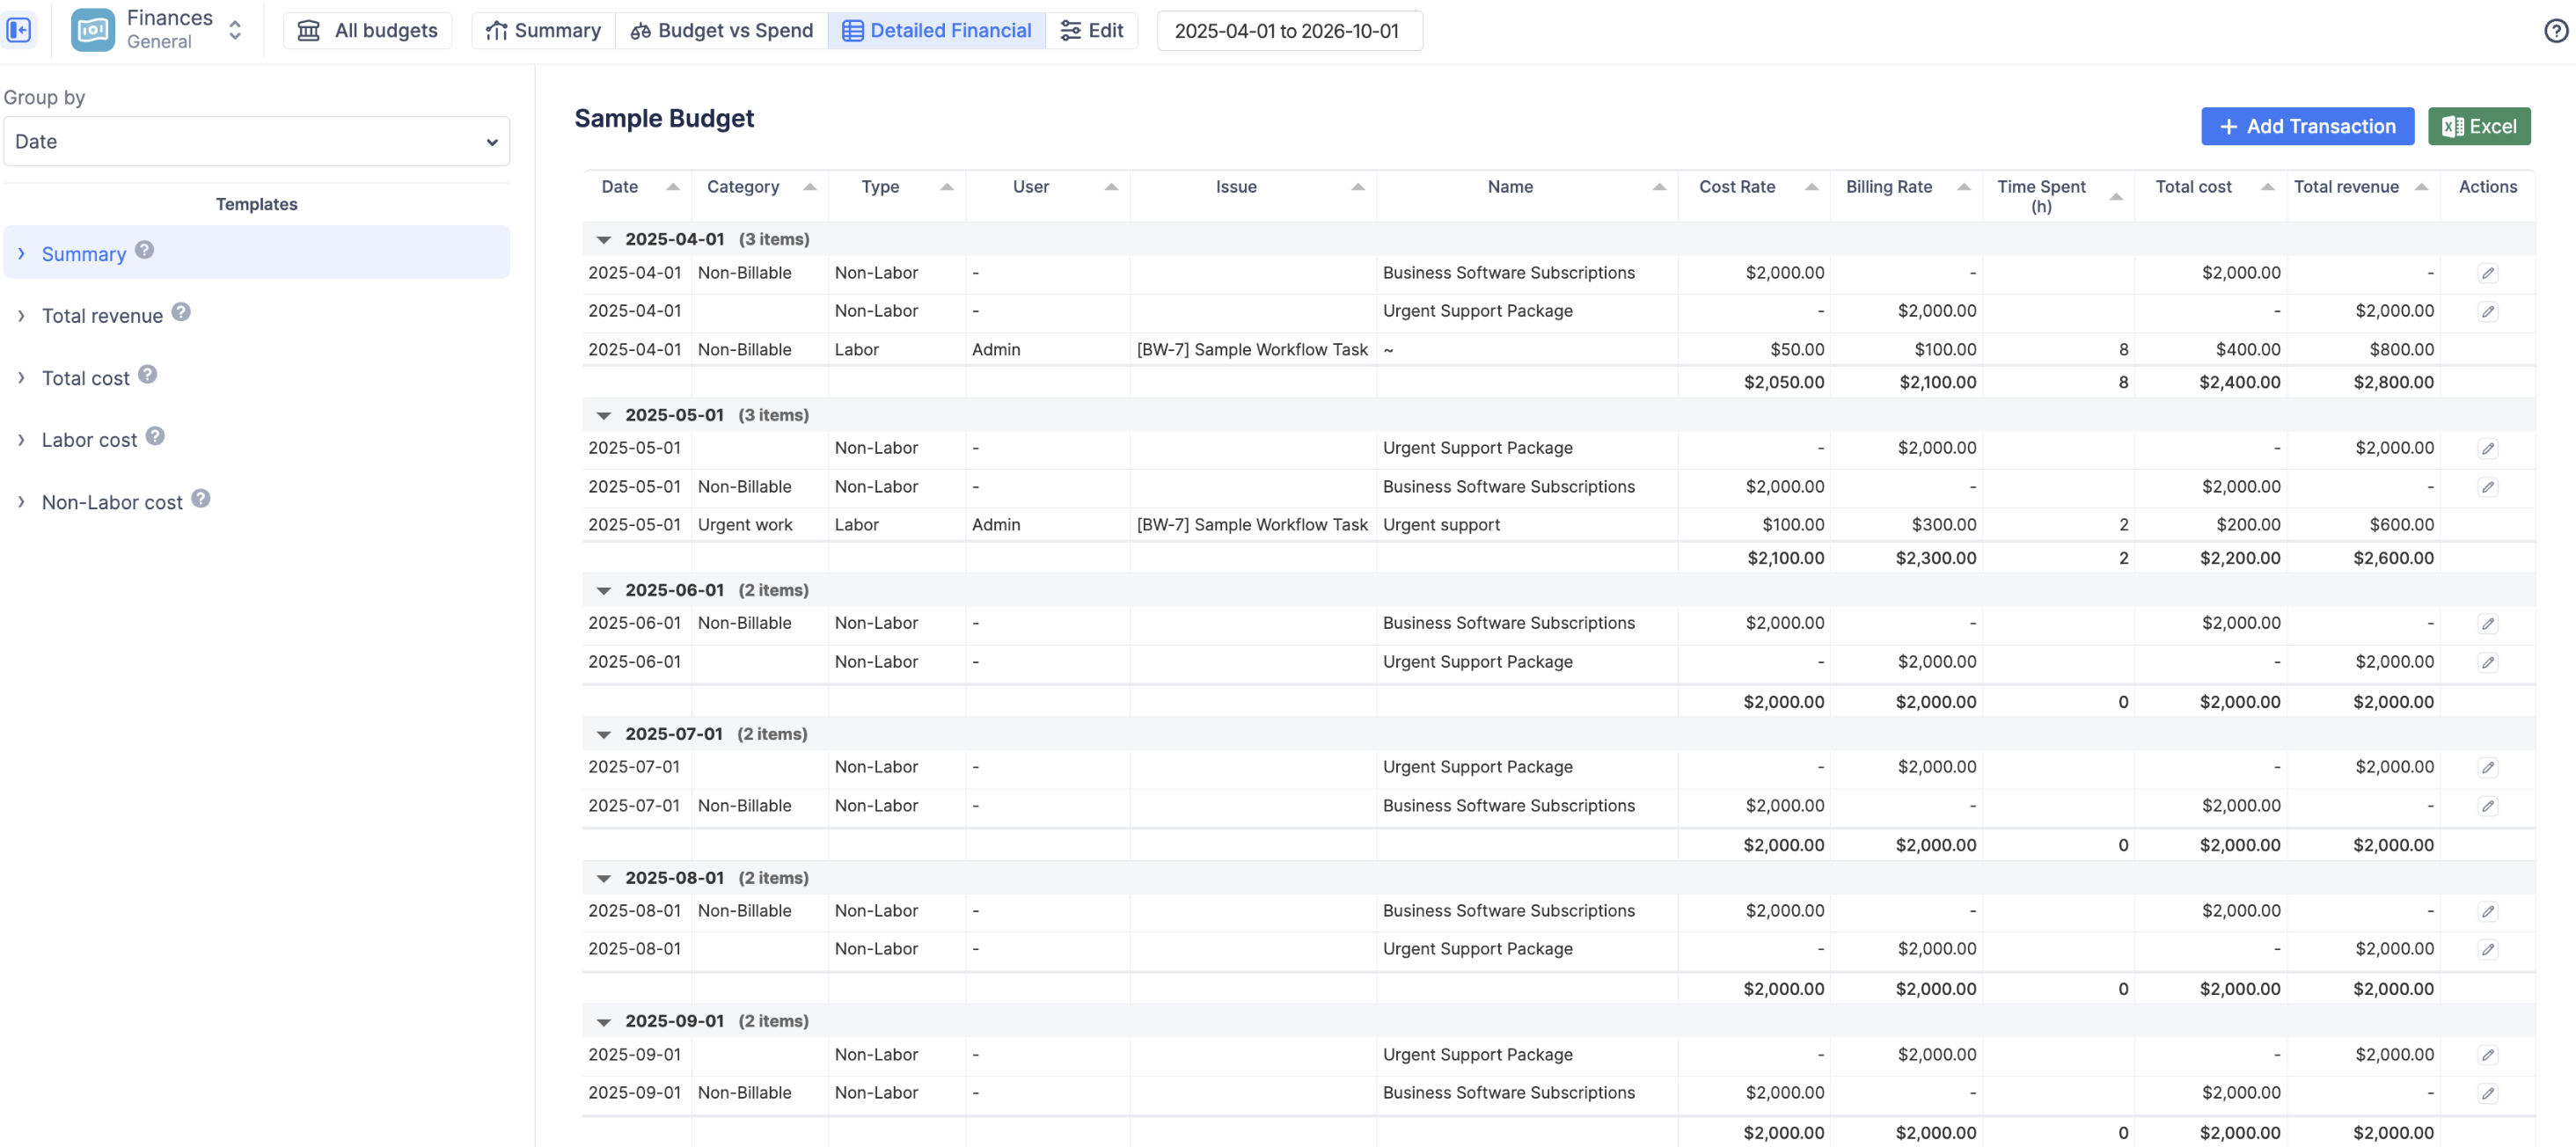
The core of this report is the data grid. It merges two distinct types of financial records into a single, unified view:
-
Labor (Hourly Worklogs): Every time a team member logs hours against a Jira issue, a new row is generated. The system calculates the
Total CostandTotal Revenueby multiplying theTime Spentby the applicable hourlyCost RateandBilling Rate. -
Labor (Monthly Rates): If a user is assigned a Monthly Rate, their cost/revenue is not tied to individual Jira worklogs. Instead, the system automatically generates a line item for that user, representing their monthly cost/revenue.
-
Non-Labor (Fixed Items): Every manual expense or revenue item you add via the + Add Transaction button appears as its own row.
-
Type: This column clearly distinguishes the source of the financial data:
-
Labor(for both hourly worklogs and prorated daily monthly rates) -
Non-Labor(for fixed manual entries).
-
-
Time Spent (h): For hourly worklogs, this shows the exact duration logged. For Monthly Rates and Non-Labor items, this column will be blank or display "N/A" as the cost is not derived from hours.
-
Cost Rate / Billing Rate:
-
For hourly Labor rows, this displays the specific hourly rate the system used.
-
For Monthly Rate rows, this displays the monthly rate on the 1st day of the month.
-
For Non-Labor rows, this will display the flat amount of the transaction.
-
-
Total Cost & Total Revenue: The finalized monetary impact of that specific line item.
-
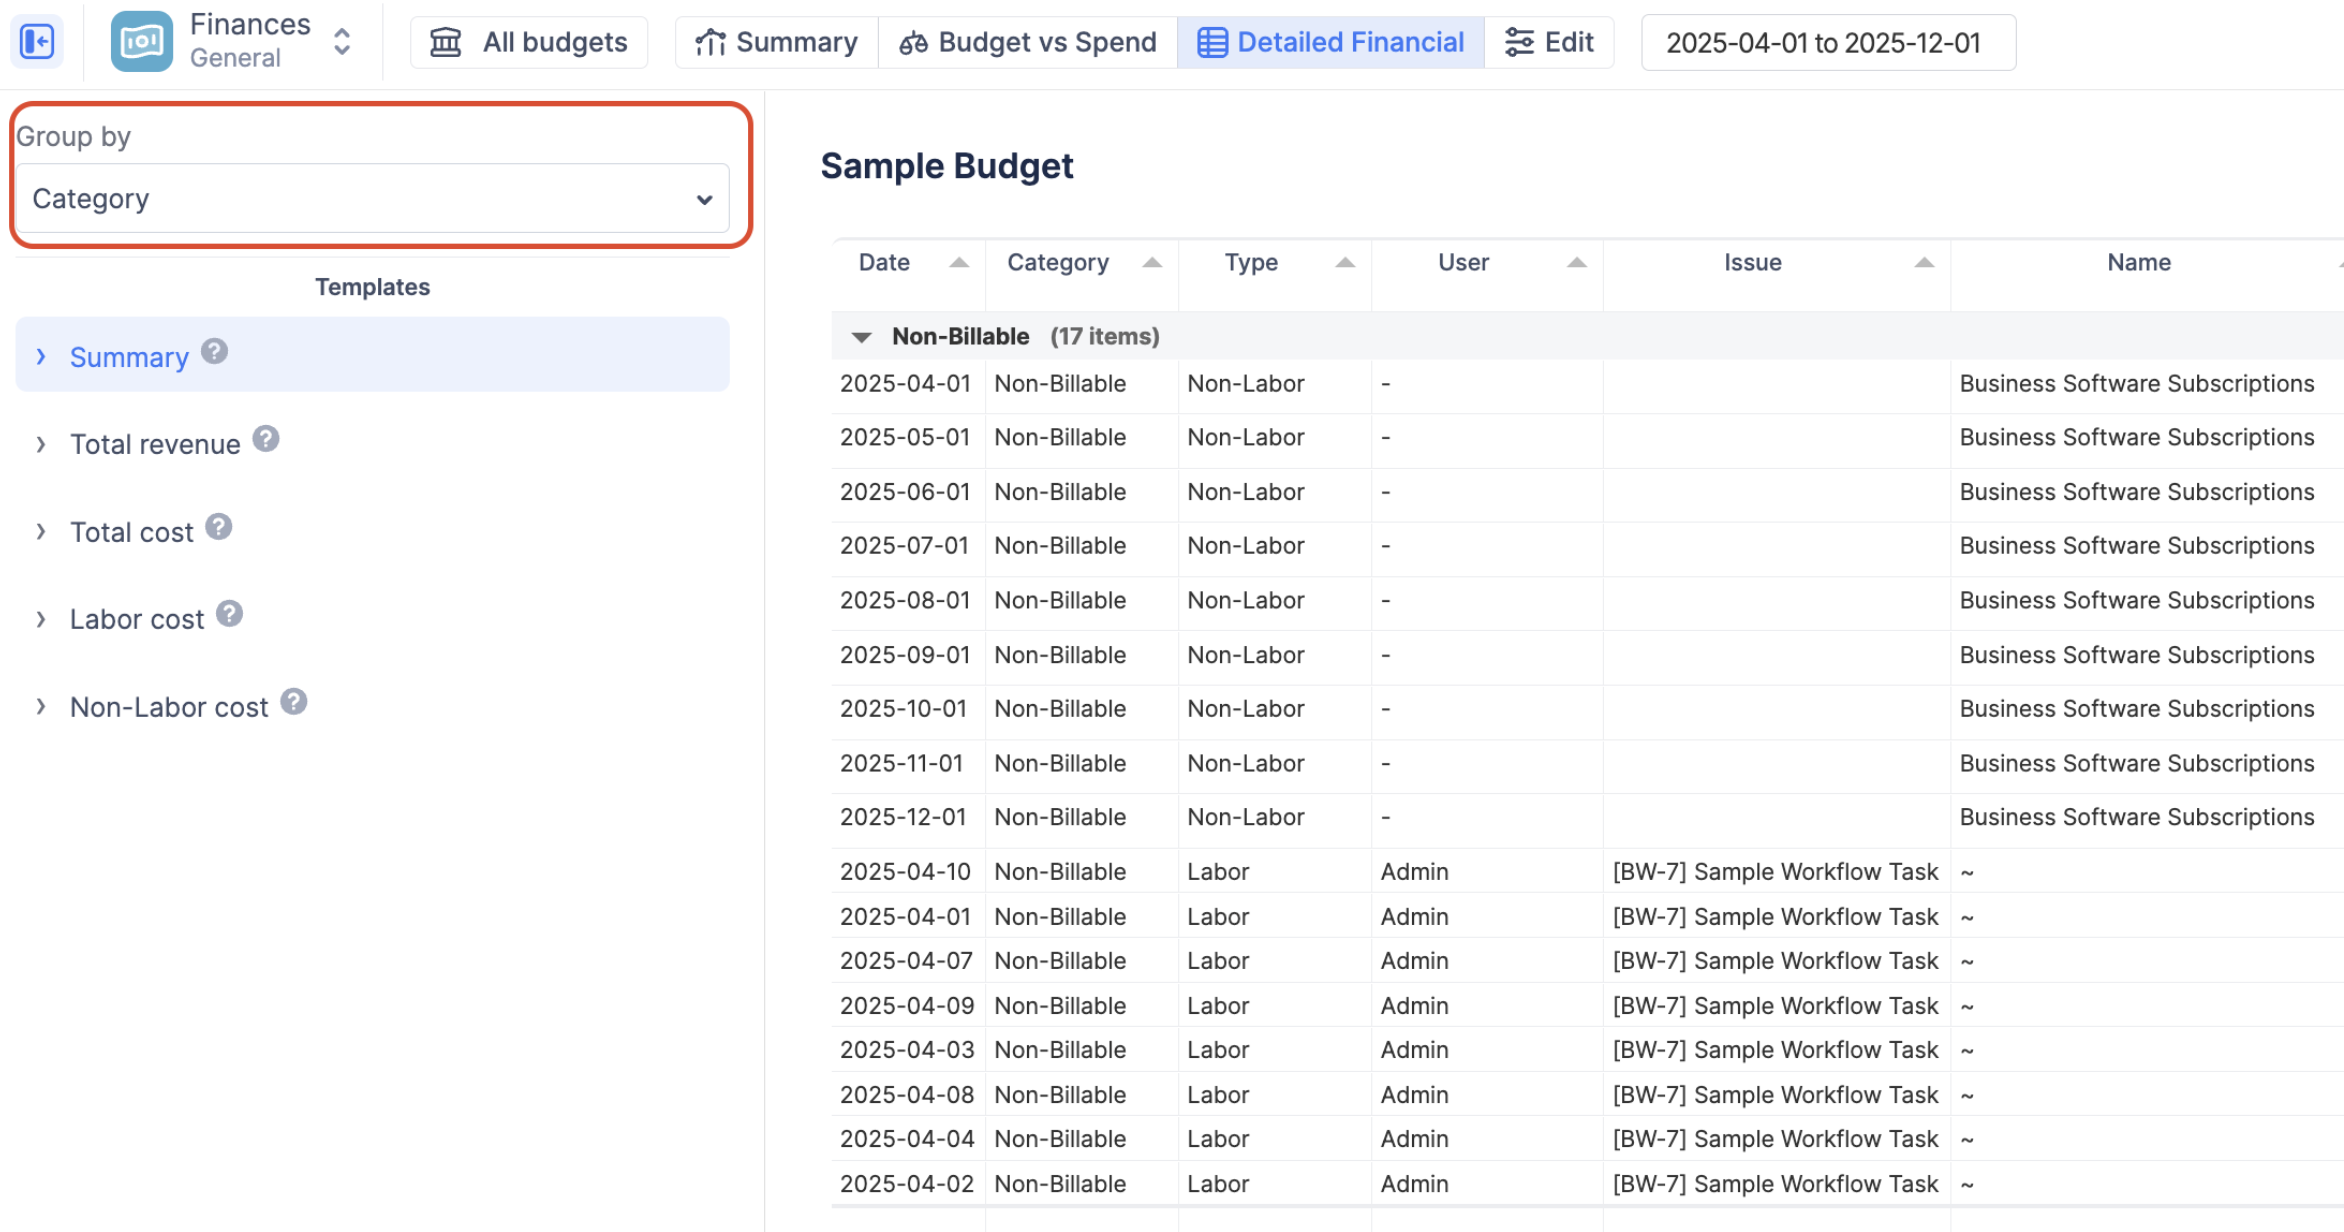
Group By
The Group by dropdown allows you to aggregate the line items by a specific dimension, such as Category, Project, User, or Epic.
When you group the data, the table becomes collapsible. Each group gets a header row showing the total number of items within it. More importantly, the system generates a Summary Row at the bottom of each group, calculating the sum of Time Spent, Total Cost, and Total Revenue for just those specific items.
-
Templates
Templates are pre-configured views designed to instantly answer common financial questions by automatically adjusting the visible columns and filtering the rows.
-
Summary: A complete overview of all logged hours, labor costs, and fixed expenses in one place.
-
Total revenue: Track incoming money. This view filters the table to show only generated revenue from billable hours and fixed revenue items.
-
Total cost: Track all outgoing spending. This view combines hourly labor costs and manually added expenses.
-
Labor cost: Focus strictly on team effort. This filters out all manual expenses, showing only costs calculated from Jira worklogs and monthly rates.
-
Non-Labor cost: Audit manual expenses. This filters out all logged hours, showing only your fixed costs (like software licenses or travel).