
Once your budget is configured and your team begins logging work in Jira, the Finances module automatically generates a suite of real-time reports.
These reports transform raw time-tracking data and fixed expenses into clear, visual insights, allowing you to monitor project health, audit costs, and analyze profitability without leaving ActivityTimeline.
You can access these reports by clicking on any budget name from the All budgets list.
The Reporting Suite
The Finances module provides three distinct reporting views, each designed to answer different types of financial questions, from high-level executive summaries to granular line-item audits.
You can seamlessly navigate between these views using the tabs at the top of your budget screen:
-
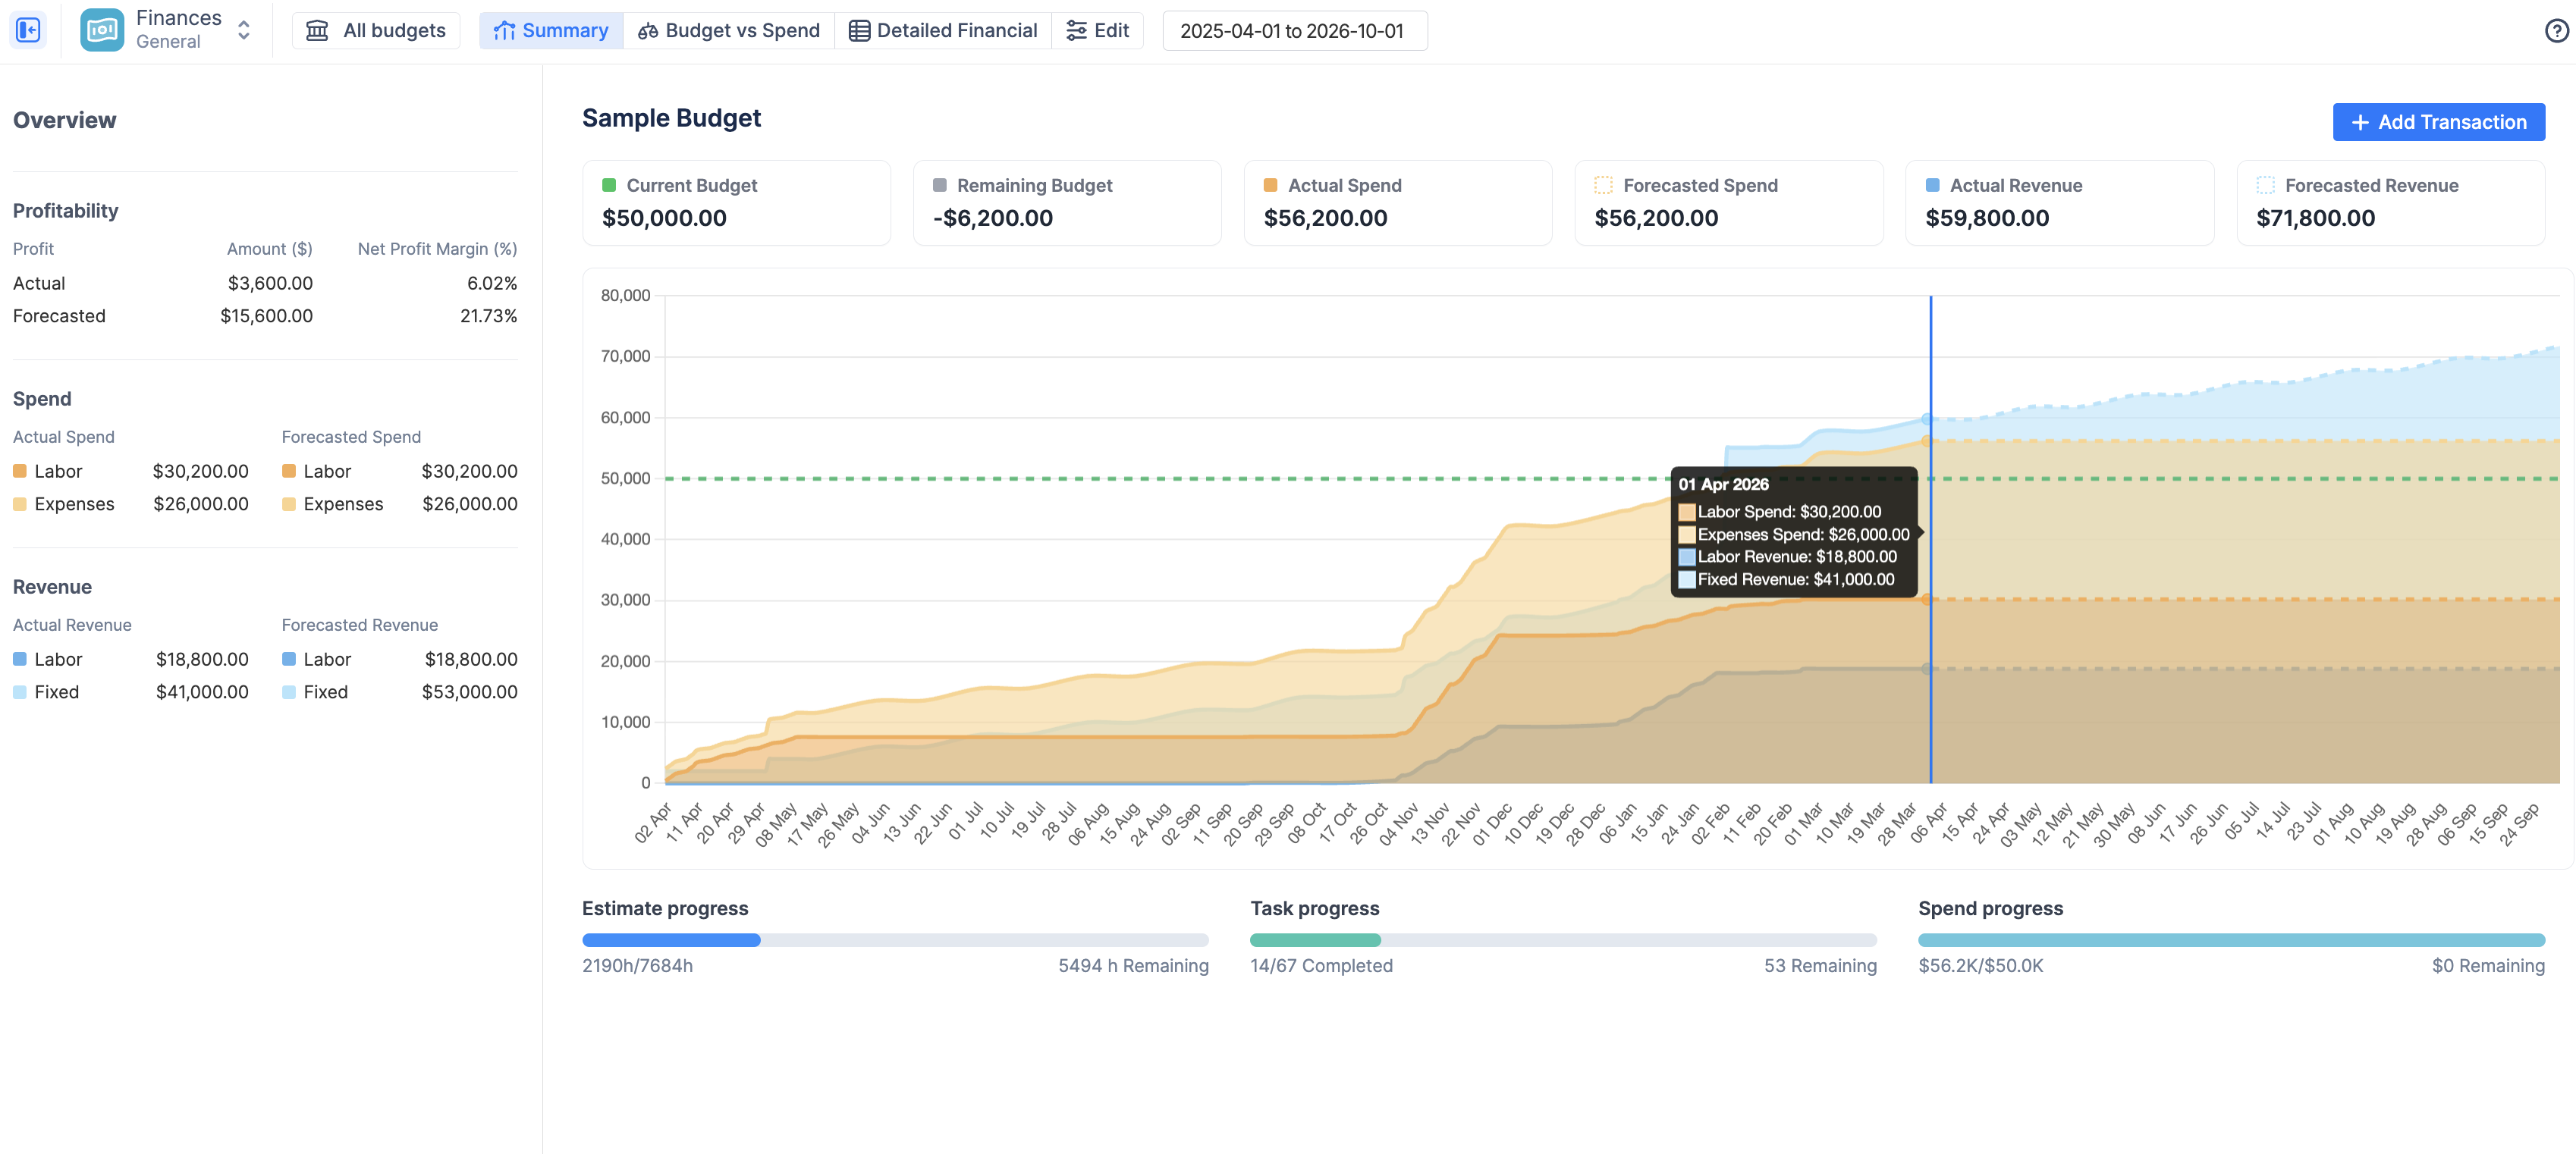
Summary Dashboard
The Summary tab is your high-level executive overview. It provides an instant snapshot of your budget's overall performance.
Use this report to answer:
-
Are we currently under or over budget?
-
What is our current and forecasted profitability?
-
How fast are we burning through our budget over time?
👉 Read the deep-dive on the Summary Dashboard
-
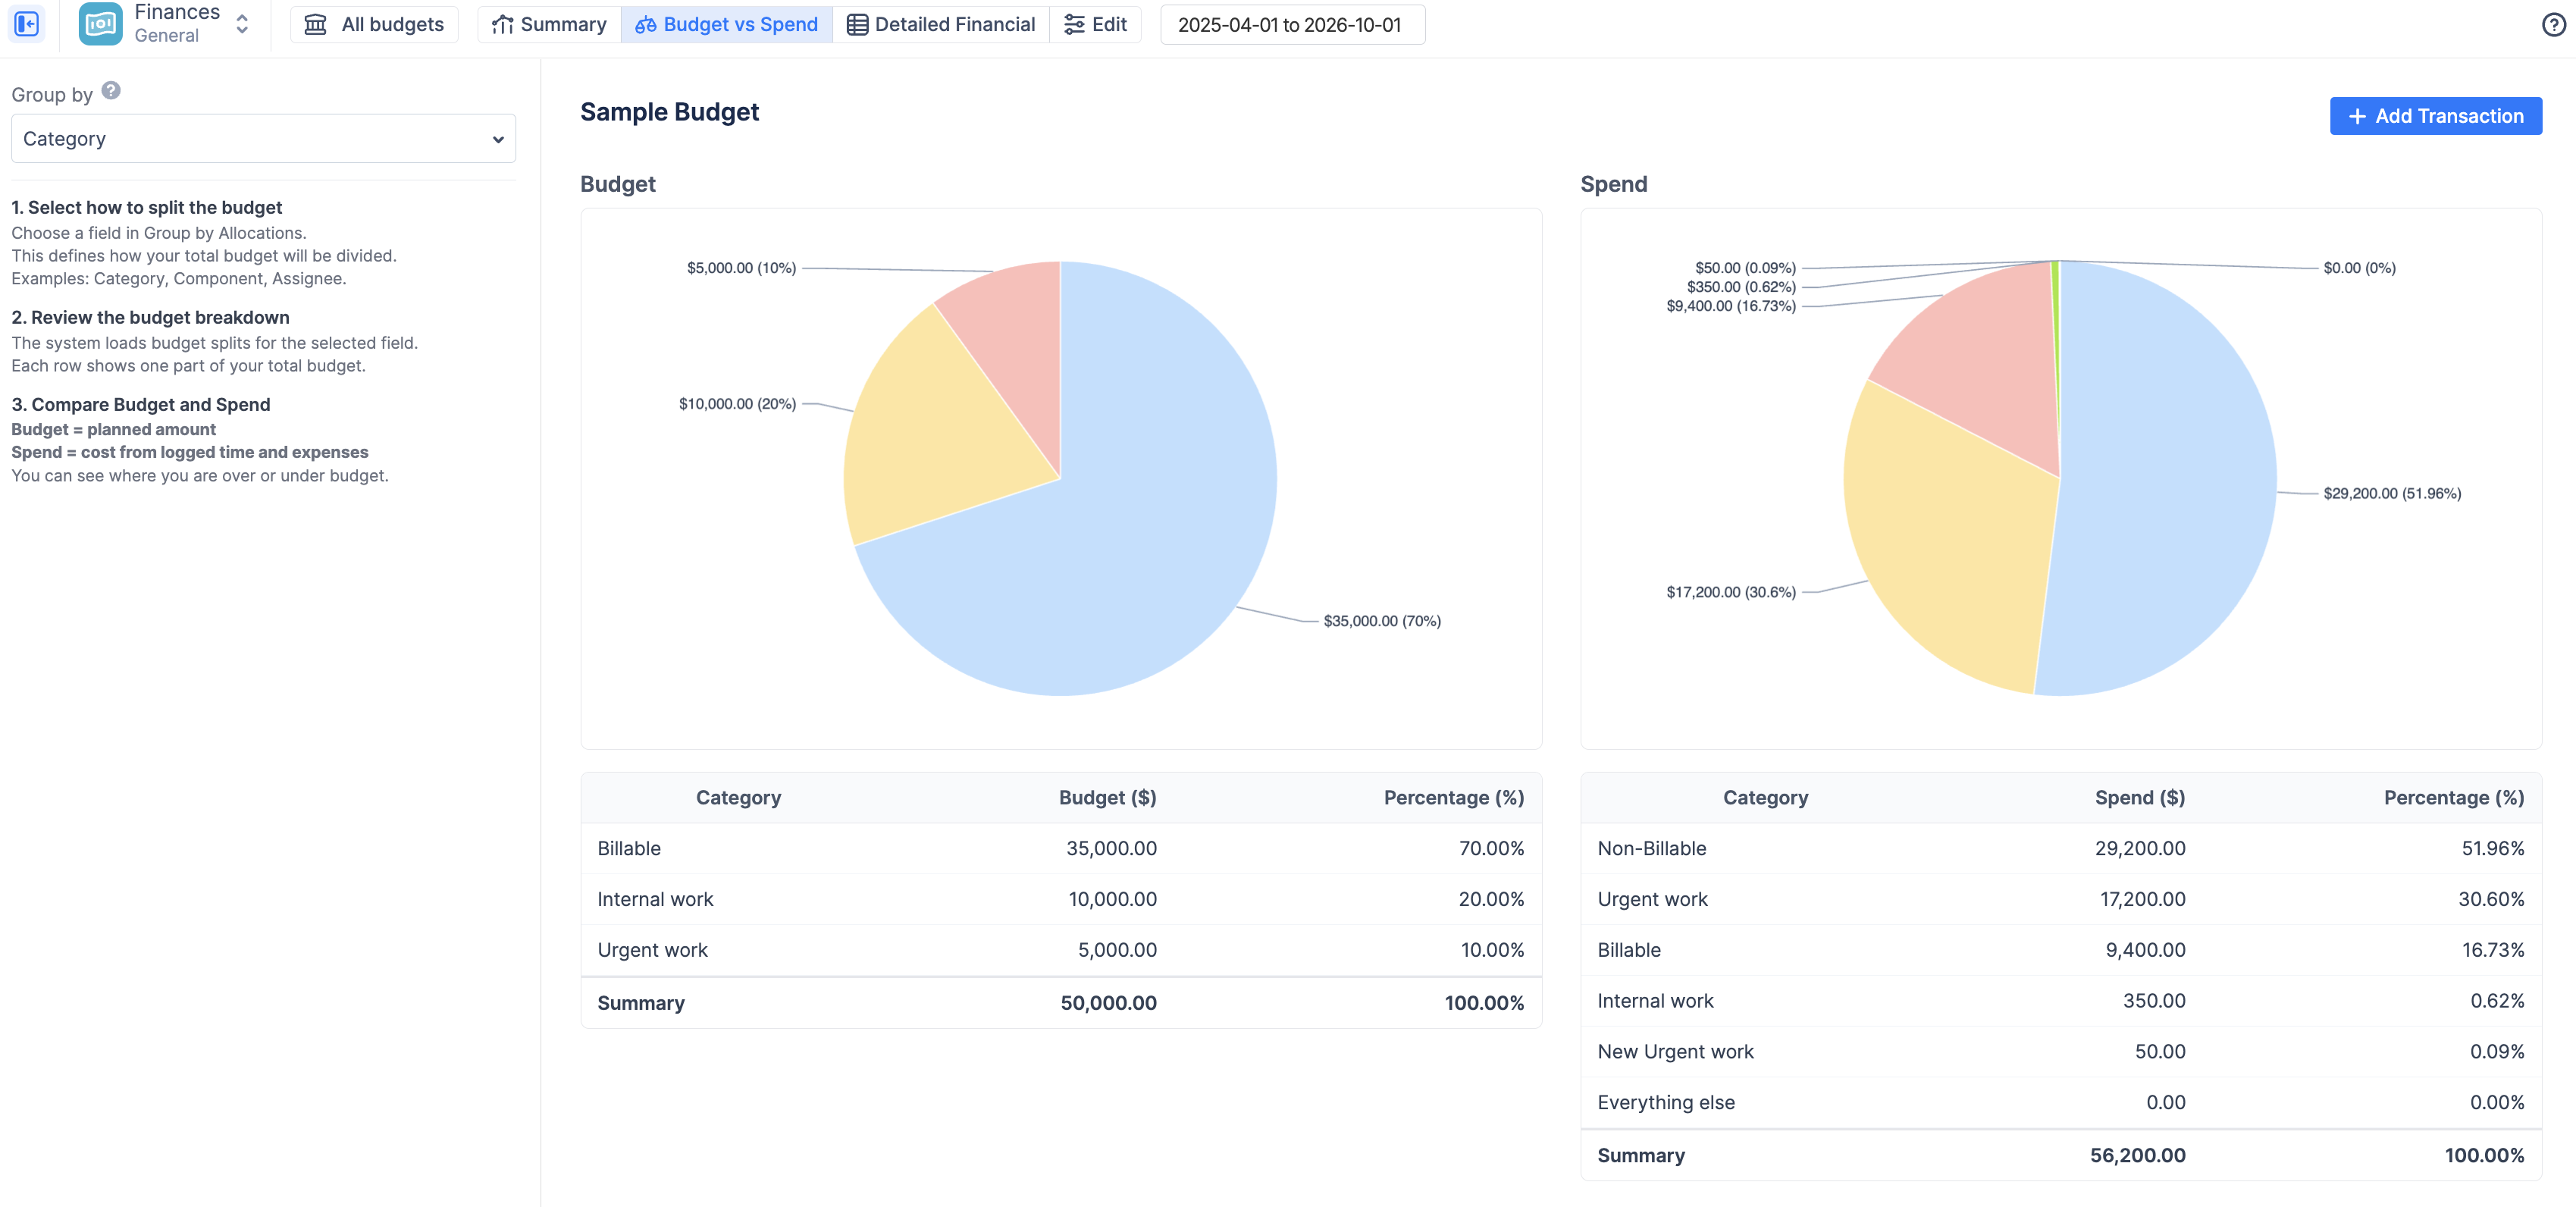
Budget vs Spend
The Budget vs Spend tab is your strategic comparison tool. It allows you to visualize the manual targets (Allocations) you set during configuration against your team's actual, real-time spending.
Use this report to answer:
-
Are we spending our budget in the areas we planned (e.g., Development vs. Support)?
-
Which specific Jira Projects or Categories are consuming the most resources?
👉 Read the deep-dive on the Budget vs Spend Report
-
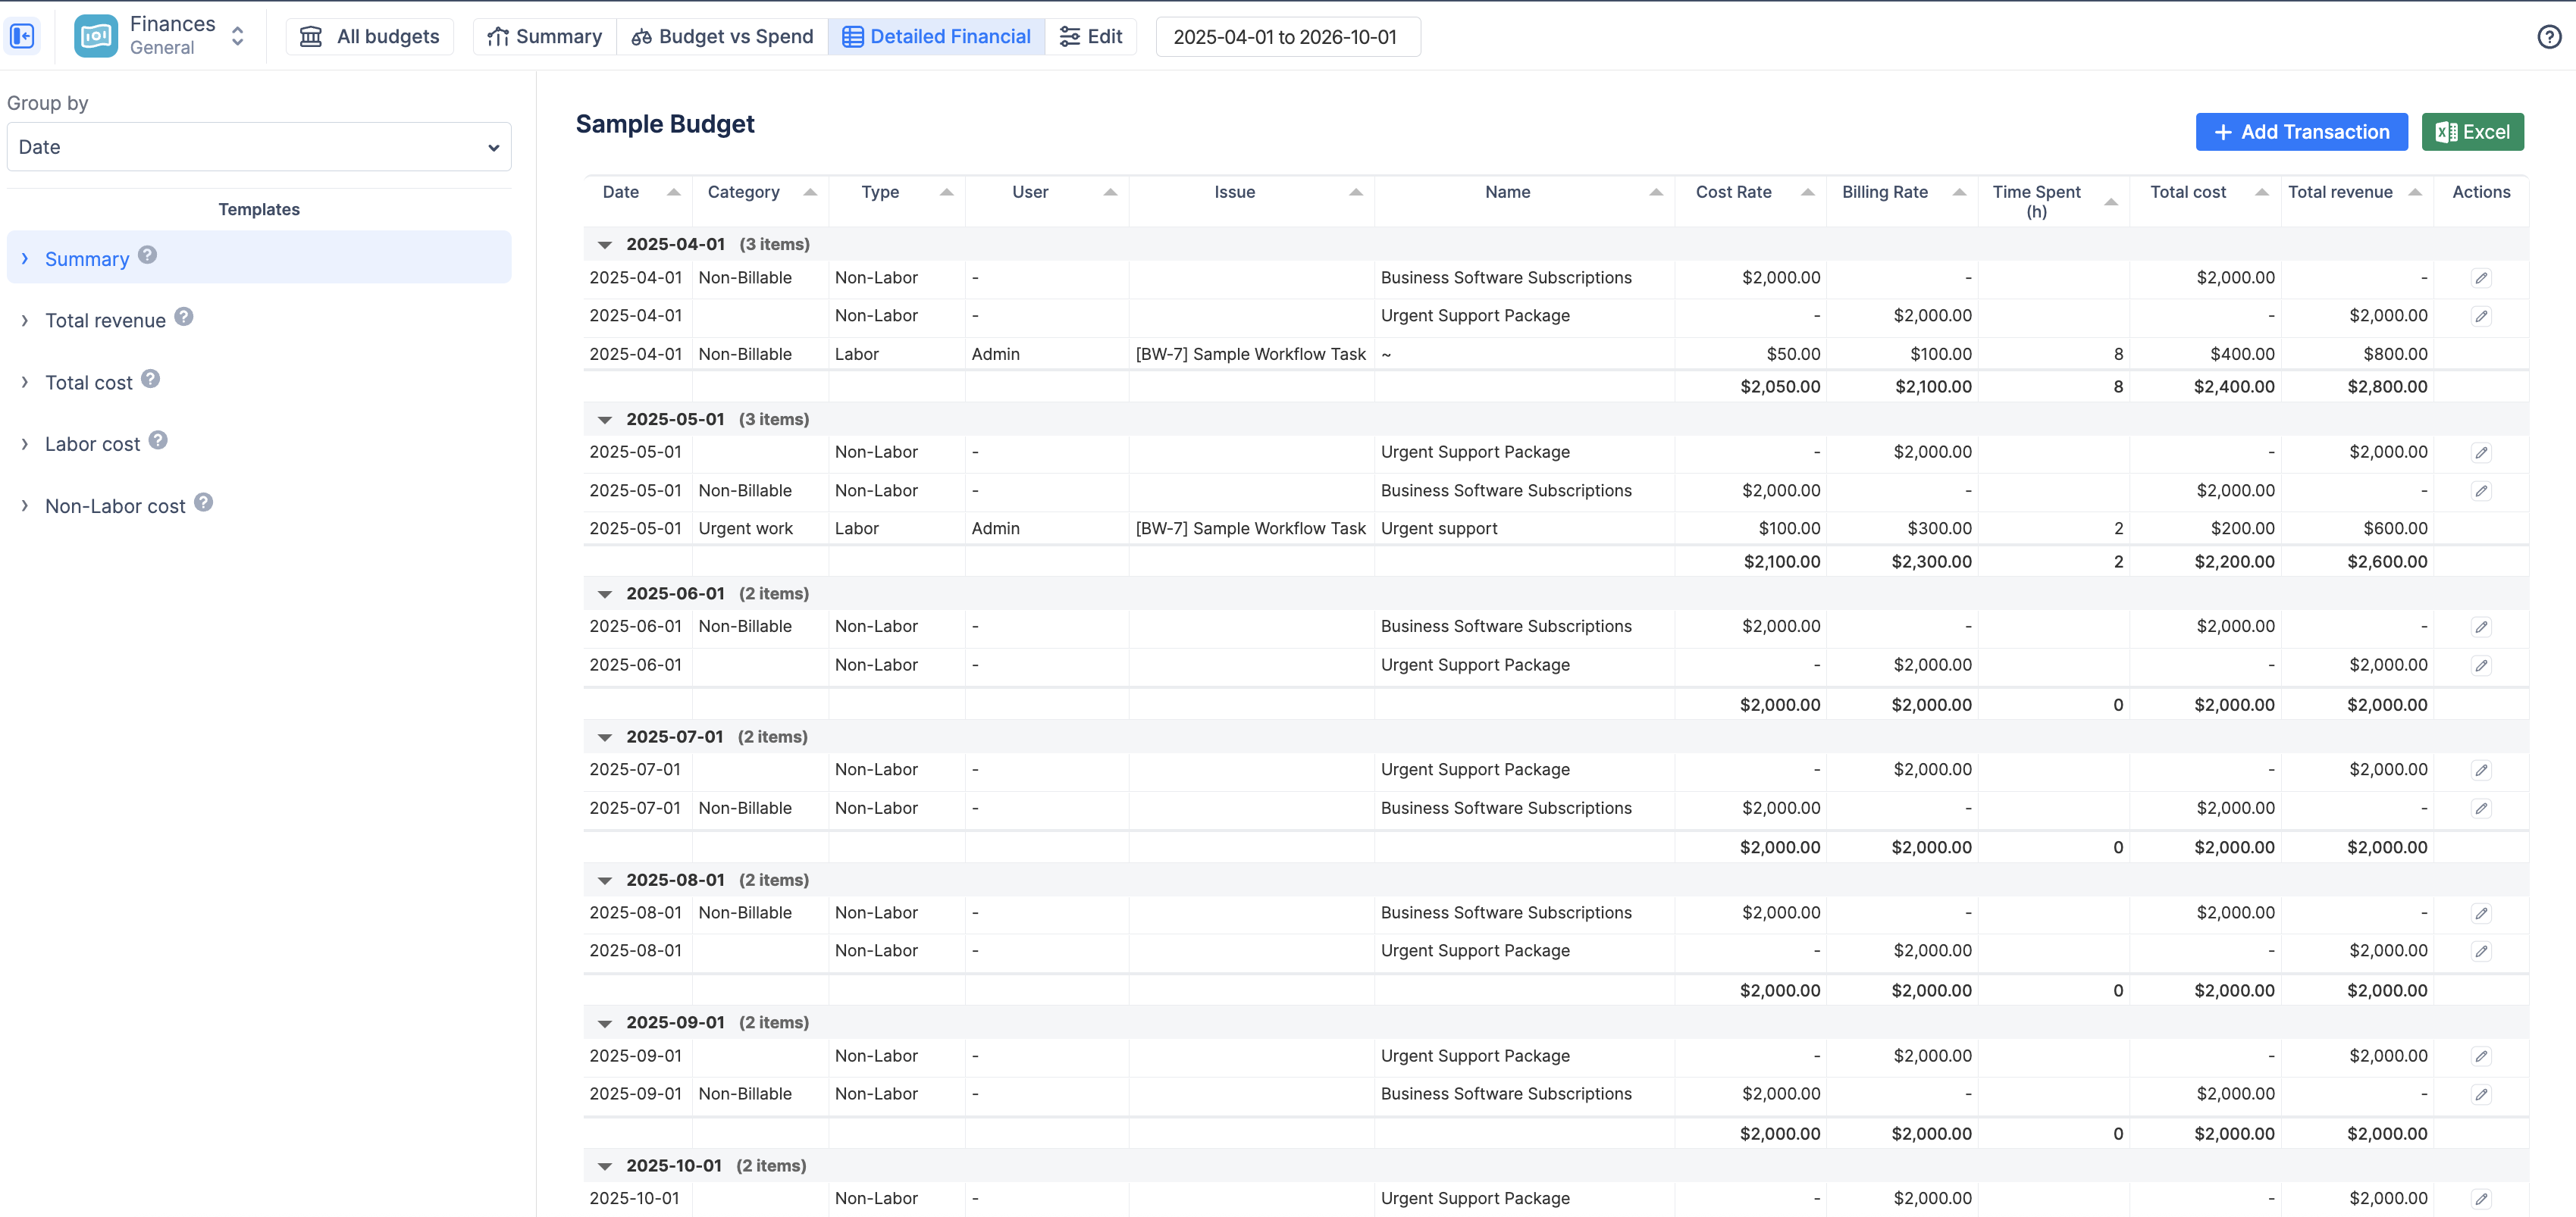
Detailed Financial
The Detailed Financial tab is your auditable ledger. It provides a comprehensive, line-by-line breakdown of every single transaction—both logged hours (labor) and manual entries (fixed expenses/revenue)—that contributes to your budget totals.
Use this report to answer:
-
Exactly who logged time yesterday, and how much did it cost?
-
What specific fixed expenses have we incurred this month?
-
I need to export a raw list of all billable work for invoicing.
👉 Read the deep-dive on the Detailed Financial Report
Common Reporting Features
Across all three report views, you have access to essential tools to manage and extract your data:
-
Date Range Picker: By default, reports display data for the entire Time Period defined in your budget settings. You can use the date picker at the top of the screen to temporarily narrow the focus to a specific month, week, or custom date range.
-
+ Add Transaction: The blue button in the top right corner allows you to instantly log manual Fixed Expenses or Revenue items without leaving your current analysis.
-
Export to Excel: The green Excel button allows you to download the currently displayed data (respecting any active filters or groupings) for offline analysis or sharing with external stakeholders.