
The Summary tab is your high-level executive dashboard. It is the first screen you see when opening a budget and provides an instant, comprehensive snapshot of your project's financial health, progress, and forecasted trajectory.
This report is designed to answer the most critical question: Are we on track, or are we going to run out of money?
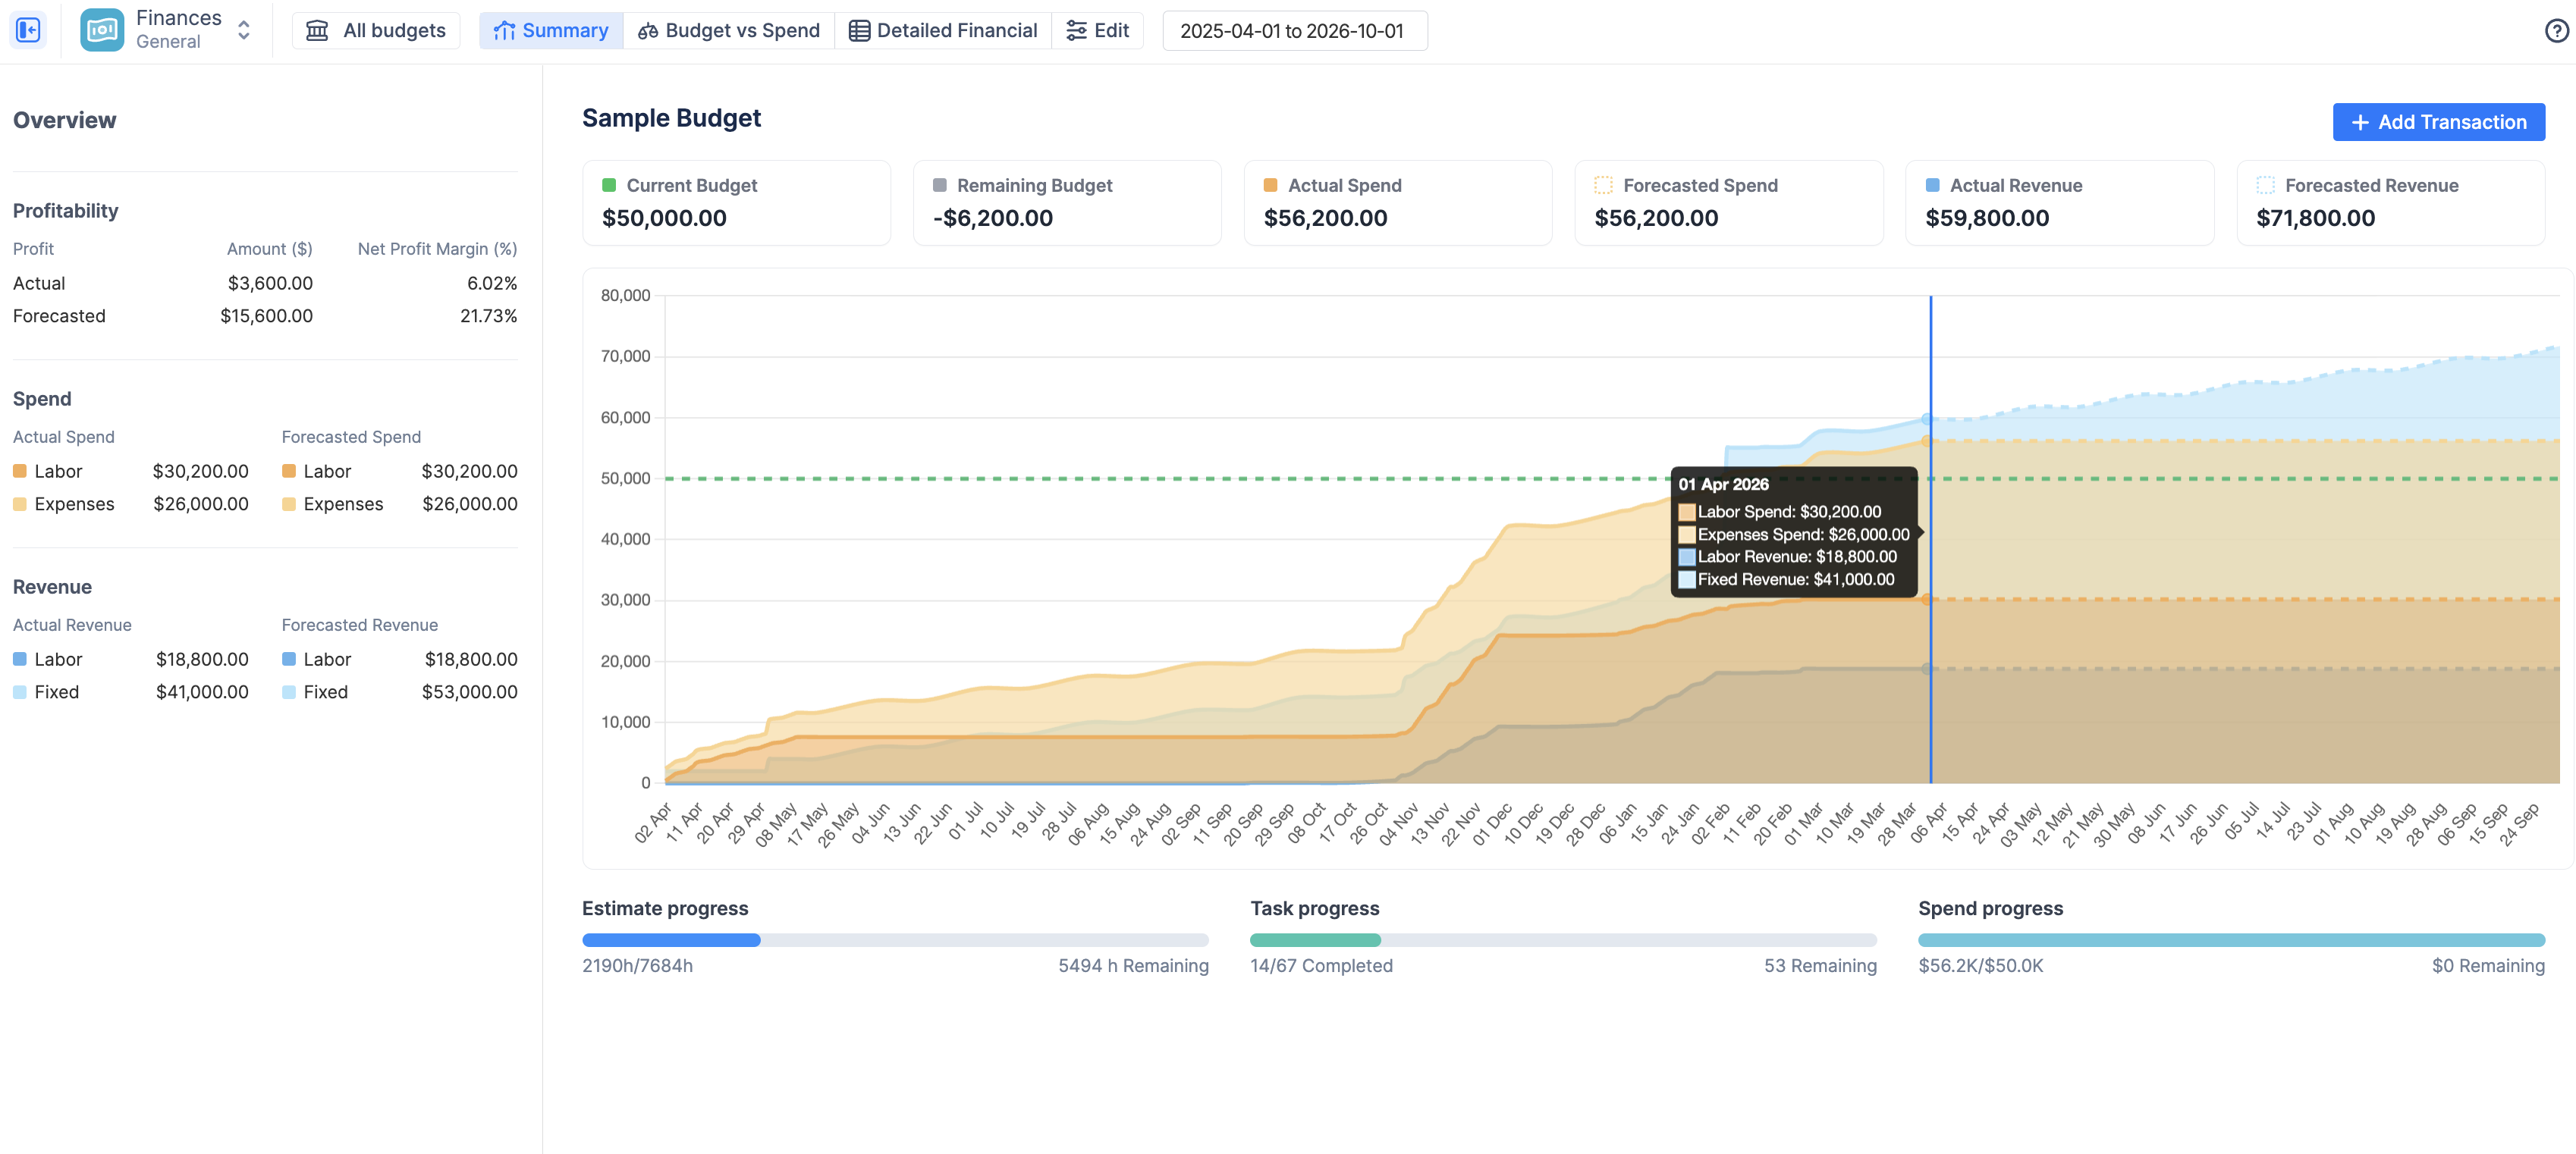
Top Summary Cards (KPIs)
At the top of the dashboard, six key metrics give you the bottom line at a glance. The values calculated here depend directly on how you configured your Budget Type and Budget Tracking settings.

-
Current Budget: The planned monetary cap for your project. This is defined by your Budget Type configuration:
-
a) Manual Budget: Displays the single, fixed value you entered.
-
b) Manual Budget with Milestones: If you configured milestones, this displays the specific budget value valid for the current day.
-
c) Estimate Based Budget: Calculated automatically by multiplying the Original Estimates of your Jira issues by the corresponding rates (using the default project rate).
-
-
Remaining Budget: The amount of money you have left to spend (
Current BudgetminusActual Spend).-
Note: This will display a negative value if you are currently over budget.
-
-
Actual Spend: The sum of all incurred Costs (Labor + Fixed) where the
Date <= Today.-
Note: Whether Labor is included depends on your "Cost Tracking" configuration.
-
-
Forecasted Spend: The predicted total cost of the project upon completion.
-
Calculated as:
Sum of all Costs (Labor + Fixed) strictly in the future (Date > Today) + Actual Spend.
-
-
Actual Revenue: The sum of all generated Revenue (Labor + Fixed) where the
Date <= Today.-
Note: Whether Labor is included depends on your "Revenue Tracking" configuration.
-
-
Forecasted Revenue: The predicted total revenue upon project completion.
-
Calculated as:
Sum of all Revenue (Labor + Fixed) strictly in the future (Date > Today) + Actual Revenue.
-
The Cumulative Trend Chart
The centerpiece of the Summary dashboard is the cumulative trend chart. This visualizes your financial data over time, allowing you to easily spot your "burn rate" and predict future outcomes.
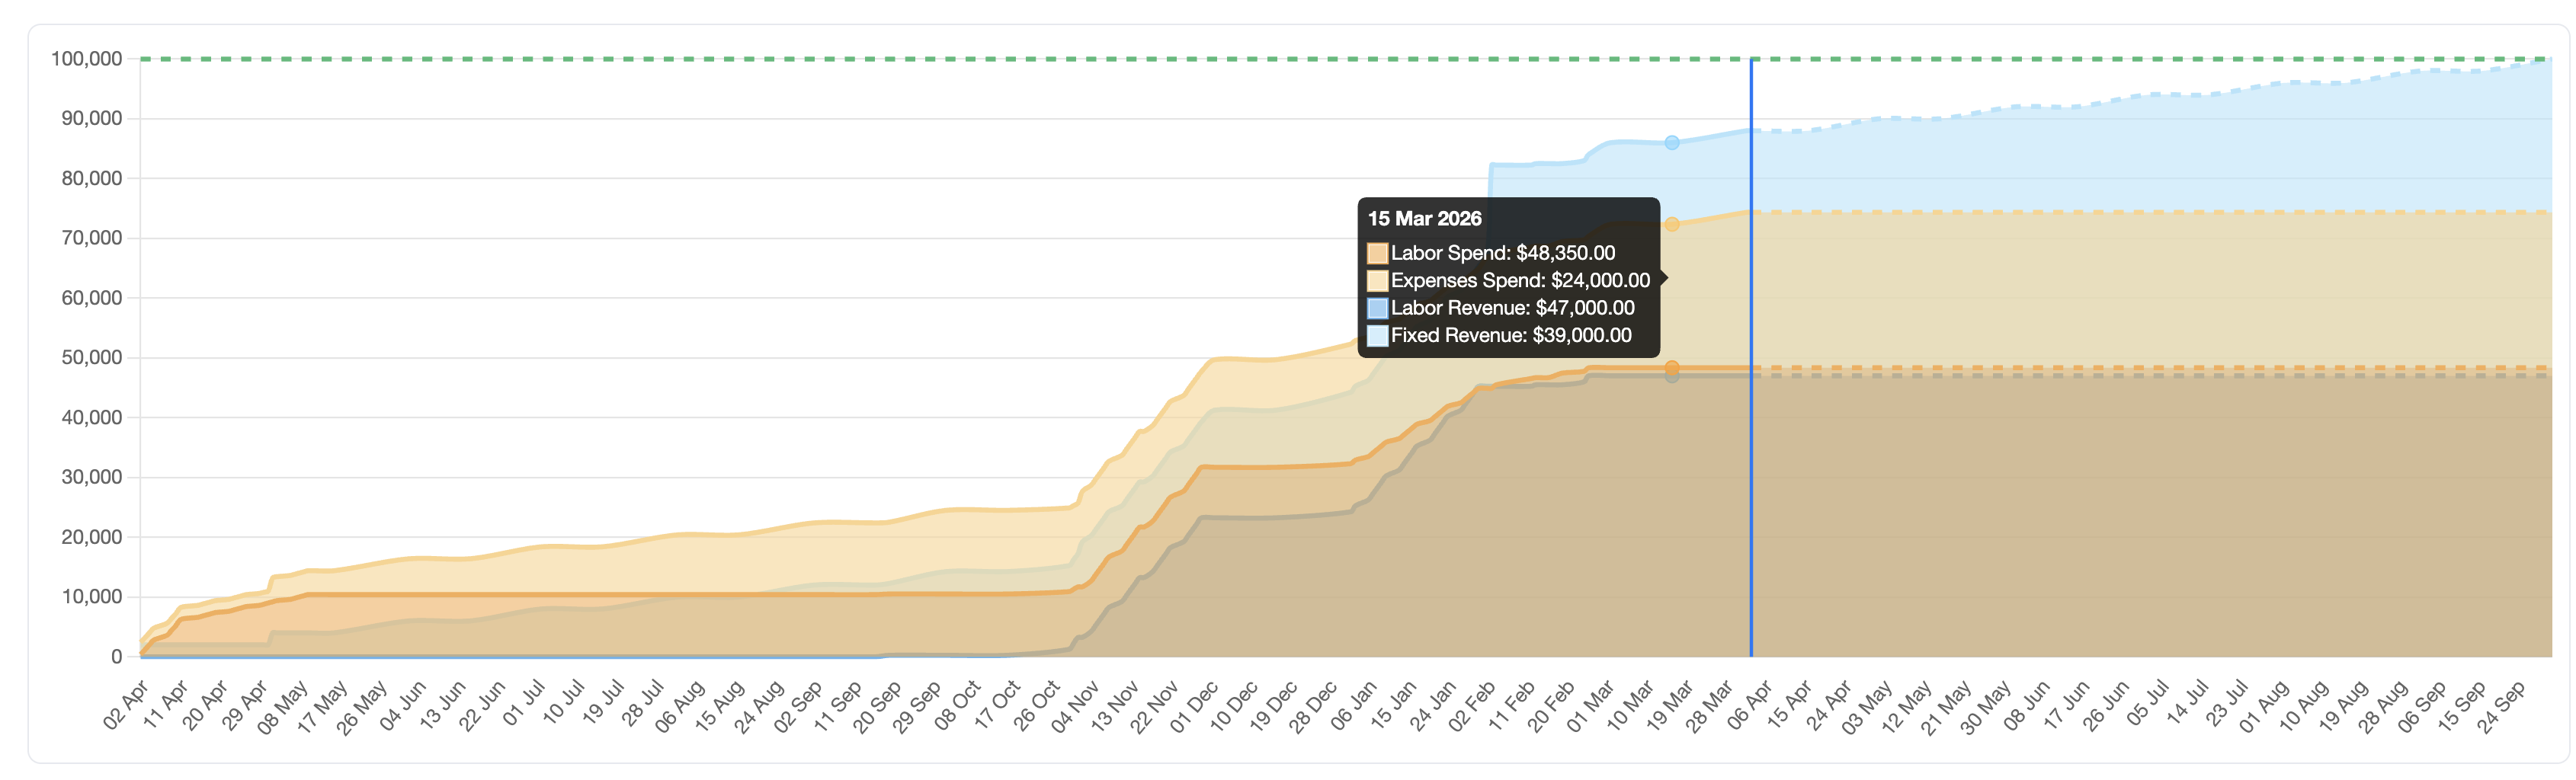
The chart plots three key lines across the lifespan of your budget. All values shown on this chart are cumulative (a running total over time).
-
The Budget Line (dashed green line)
This line represents your target or planned budget. Its shape depends entirely on your chosen Budget Type:
-
Manual Budget (Single Value): A straight, flat horizontal line representing your fixed cap.
-
Manual Budget with Milestones: A "stepped" line that jumps up on specific dates according to the milestones you configured.
-
Estimate-Based Budget: A line calculated based on the original estimates of the Jira issues in your scope multiplied by the default project rate.
-
The Spend Line (Orange/Yellow)
This line tracks your costs. It is divided into two distinct sections by the current date line ("Today").
-
Actual Spend (Solid Line, Past/Present): The cumulative sum of all your costs (Labor + Fixed) day by day, where the date is on or before today.
-
Forecasted Spend (Dashed/Shaded Area, Future): Your projected spending trajectory. It starts from your current Actual Spend total and adds any known costs occurring strictly in the future (Date > Today).
-
The Revenue Line (Teal/Green)
This line tracks your generated income, following the exact same past/future split logic as the Spend line.
-
Actual Revenue (Solid Line, Past/Present): The cumulative sum of all your revenue (Labor + Fixed) day by day, where the date is on or before today.
-
Forecasted Revenue (Dashed/Shaded Area, Future): Your projected revenue trajectory, adding any known income strictly in the future (Date > Today).
important Understanding the Forecast:
It is important to note that forecasted lines do not rely on abstract Jira task estimates. Instead, the system builds the forecast from concrete financial data scheduled in the future.
Future costs and revenue are calculated by looking at:
-
Future Worklogs: Time that has already been logged on dates in the future.
-
Scheduled Transactions: Single or recurring fixed expenses and revenue items dated in the future.
-
Monthly Rates: Fixed monthly user costs or billing rates (e.g., a monthly salary) applied to upcoming months within the budget period.
If your Forecasted Spend (dashed orange line) crosses above your Budget (blue line), the chart visually warns you that you are on track to exceed your budget based on your currently scheduled future costs.
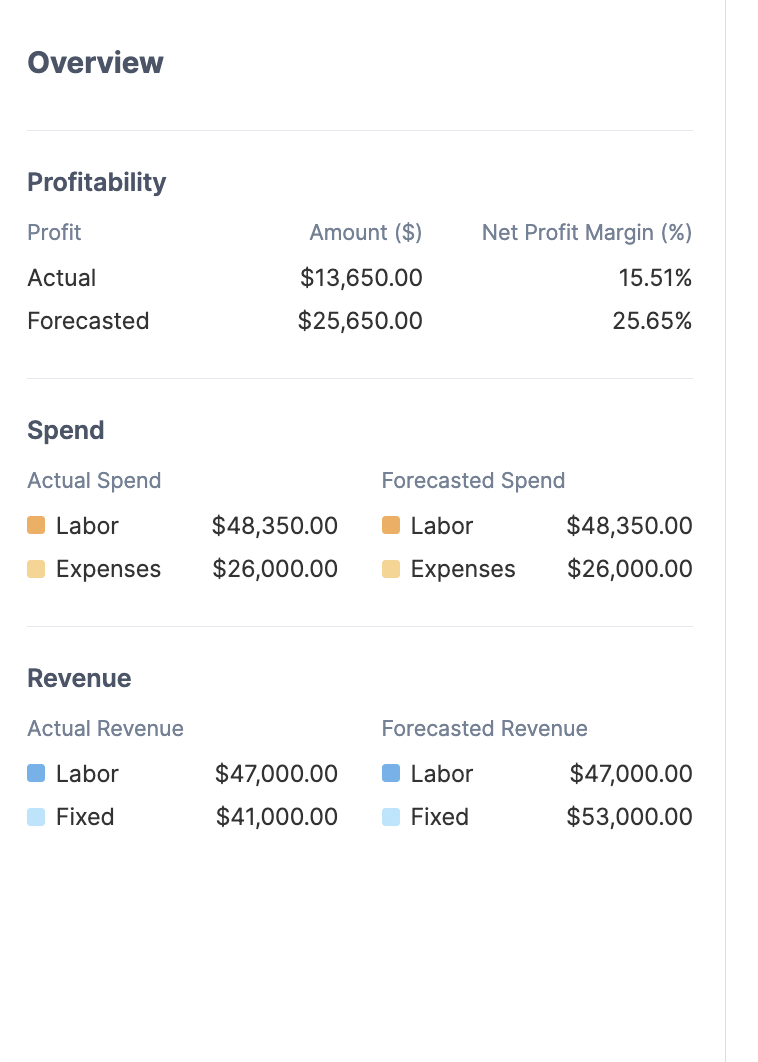
Profitability & Breakdown Sidebars
The left-hand sidebar acts as a magnifying glass for your top-level KPIs, breaking them down so you can understand exactly where your money is going and coming from.
-
Profitability
This section answers the ultimate question of financial success by calculating the difference between your revenue and your costs. It provides both the raw monetary amount and the Net Profit Margin percentage.
-
Actual: Your current profitability based strictly on data up to today (
Actual RevenueminusActual Spend). -
Forecasted: Your predicted final profitability at the end of the project (
Forecasted RevenueminusForecasted Spend).
💡 Note: If your budget is configured with "Revenue Tracking" disabled (e.g., an internal cost center), this section may display negative values or N/A.
|
Field |
Calculation Logic |
|
Actual Profit |
|
|
Actual Margin % |
If Revenue is 0, display N/A. |
|
Forecasted Profit |
|
|
Forecasted Margin % |
|
-
Spend Breakdown
This section dissects your total costs to show how much is driven by team effort versus fixed purchasing.
-
Labor: The total cost calculated automatically by multiplying your team's logged Jira hours by their configured Cost Rates.
-
Expenses: The total of all fixed costs you have manually entered via the
+ Add Transactionbutton (e.g., hardware, travel, contractors).
-
Revenue Breakdown
Similar to Spend, this shows the sources of your project's income.
-
Labor: The total income calculated automatically by multiplying your team's billable Jira hours by their configured Billing Rates.
-
Fixed: The total of all fixed income you have manually entered via the
+ Add Transactionbutton (e.g., a milestone payment or a fixed contract fee).
|
Field |
Calculation Logic |
|
Spend: Labor |
Sum of |
|
Spend: Expenses |
Sum of |
|
Spend: Forecasted |
Future Labor: Sum of Future Fixed: Sum of |
|
Revenue: Labor |
Sum of |
|
Revenue: Fixed |
Sum of |
|
Revenue: Forecasted |
Future Labor: Sum of Future Fixed: Sum of |
Progress Indicators
Located at the bottom of the dashboard, these three progress bars provide a critical "reality check" by comparing your financial burn rate against the actual physical progress of the work in Jira.

By comparing these three bars, managers can quickly spot trouble.
-
Estimate progress: Shows the percentage of your total estimated hours that have already been logged.
-
Calculation:
Sum of Logged Hours / Sum of Original Estimates
-
-
Task progress: Shows the percentage of Jira issues within your budget's scope that have been completed (moved to a "Done" status).
-
Calculation:
Resolved Issues Count / Total Issues Count
-
-
Spend progress: Shows how much of your total allocated budget you have consumed.
-
Calculation:
Actual Spend / Current Budget
-
💡 How to use them together:
If your Spend progress is at 80%, but your Task progress is only at 40%, it is a massive red flag. It indicates that you have spent the majority of your money but completed less than half the work, meaning the project is severely underestimated and likely to run out of funds.