
While your "Total Budget" provides a high-level spending cap, effective financial management requires understanding how that money is distributed.
The Budget Allocations configuration allows you to manually break down your total budget into specific, targeted sub-budgets. You define these targets based on custom dimensions (like Jira Categories, Components, or Assignees).
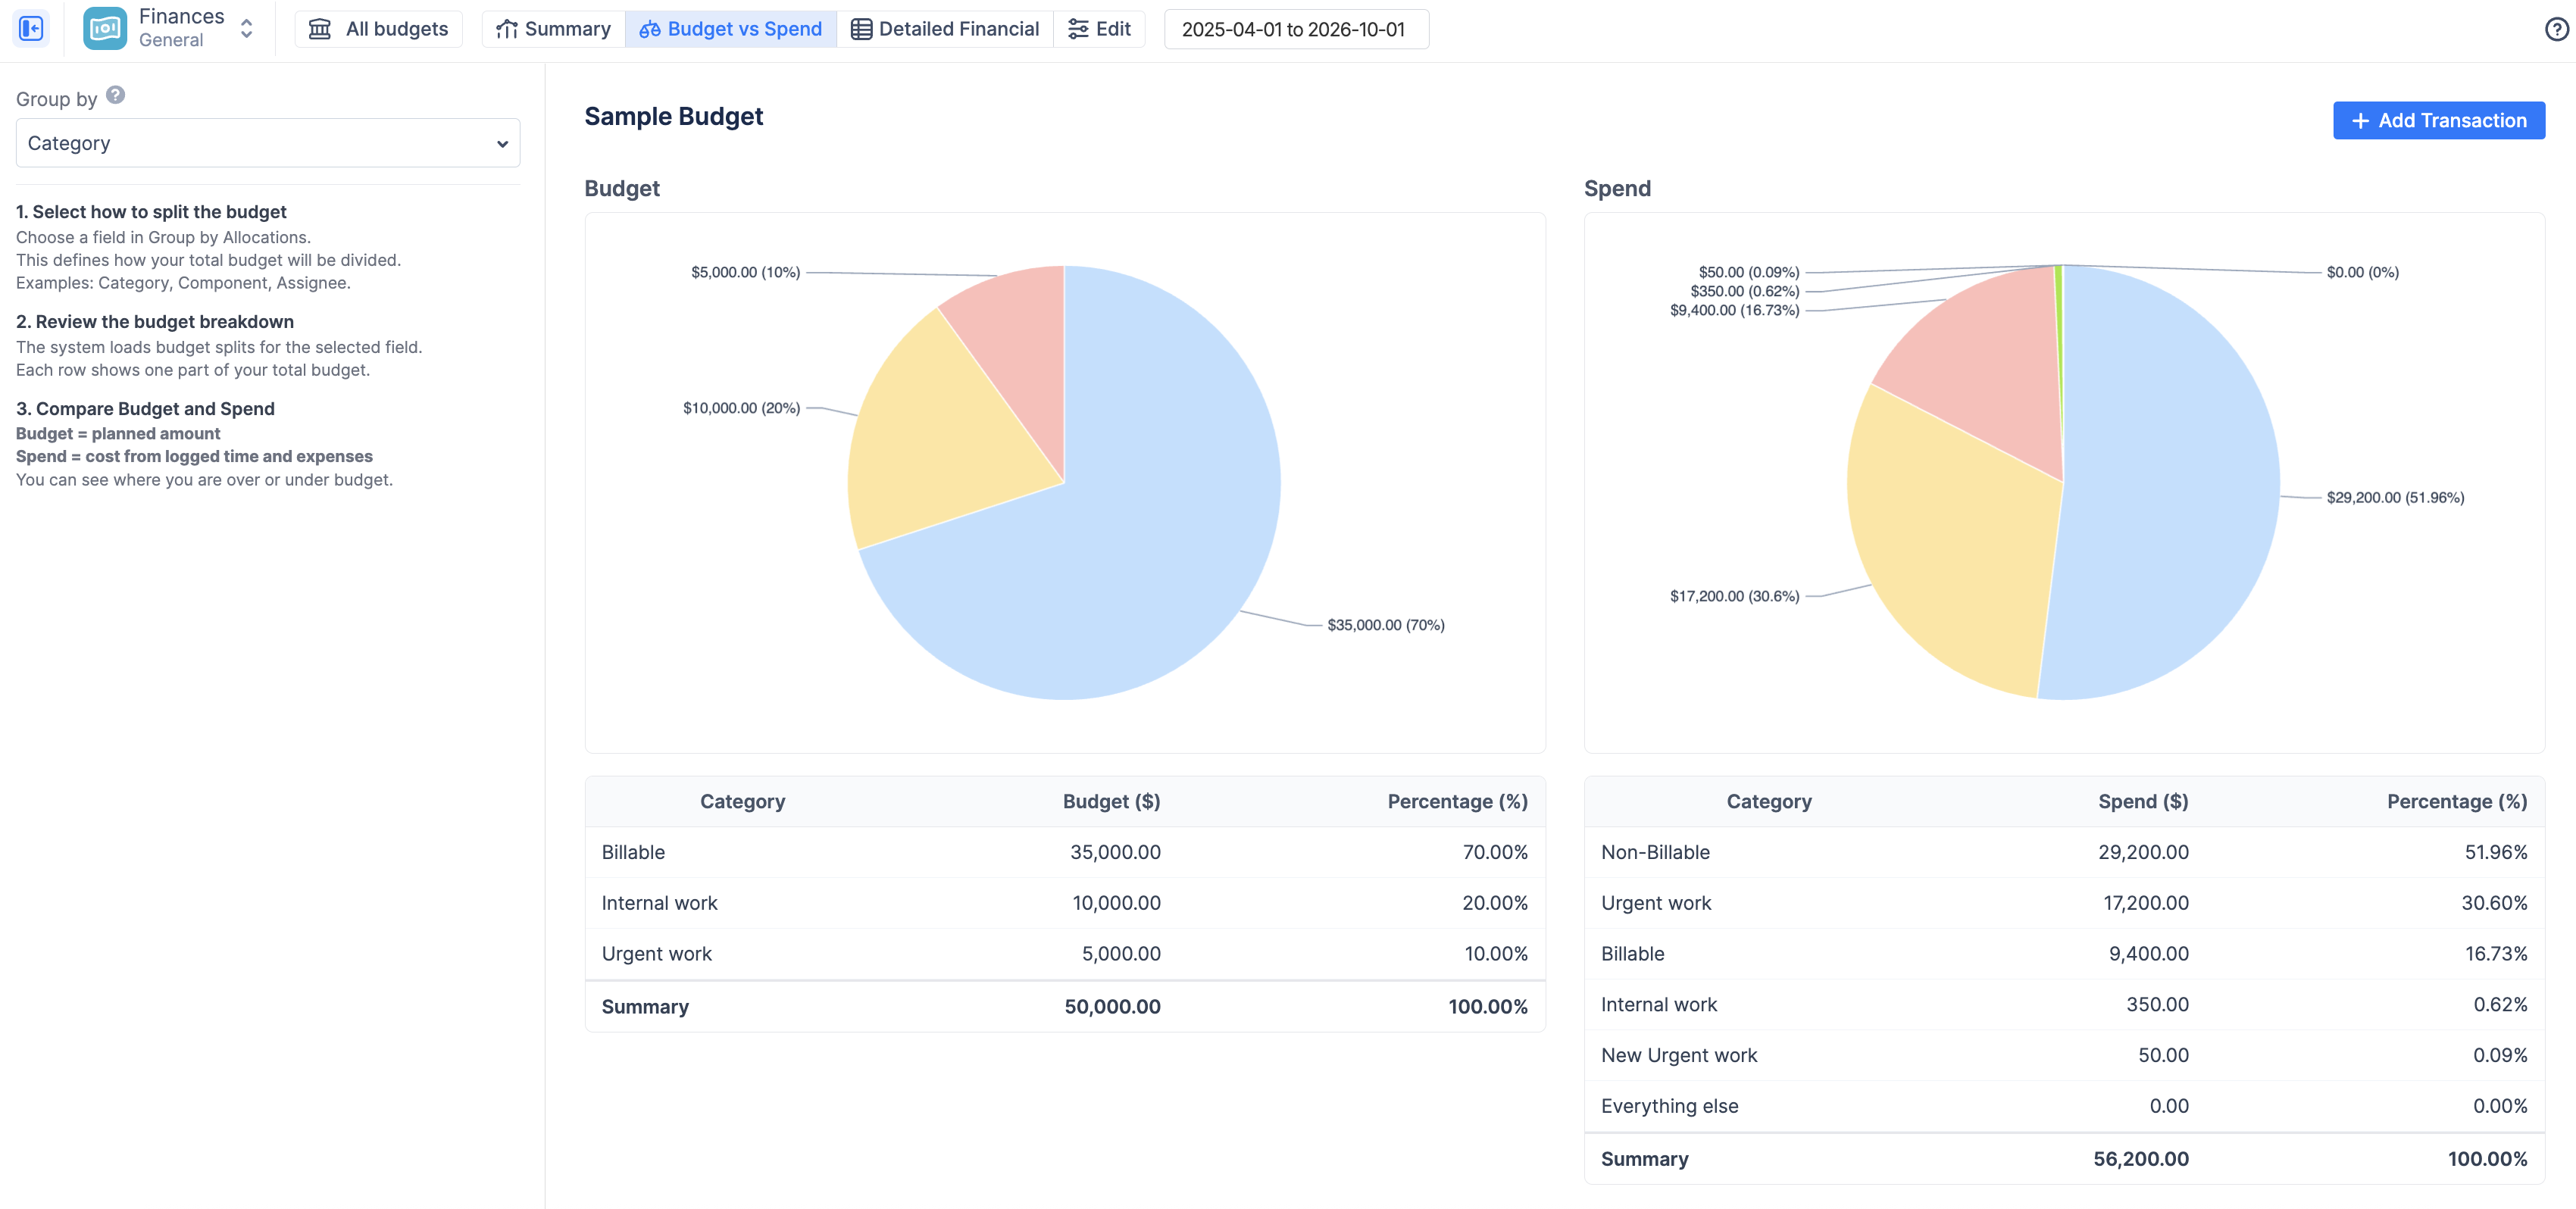
These manual allocations are the engine that powers the "Budget" (Target) side of your Budget vs Spend report, allowing you to visually compare your planned strategy against your team's actual expenditure.
Setting Up Allocations
To create your spending targets:
-
Navigate to the Configurations of your budget and select the Budget Allocations tab.
-
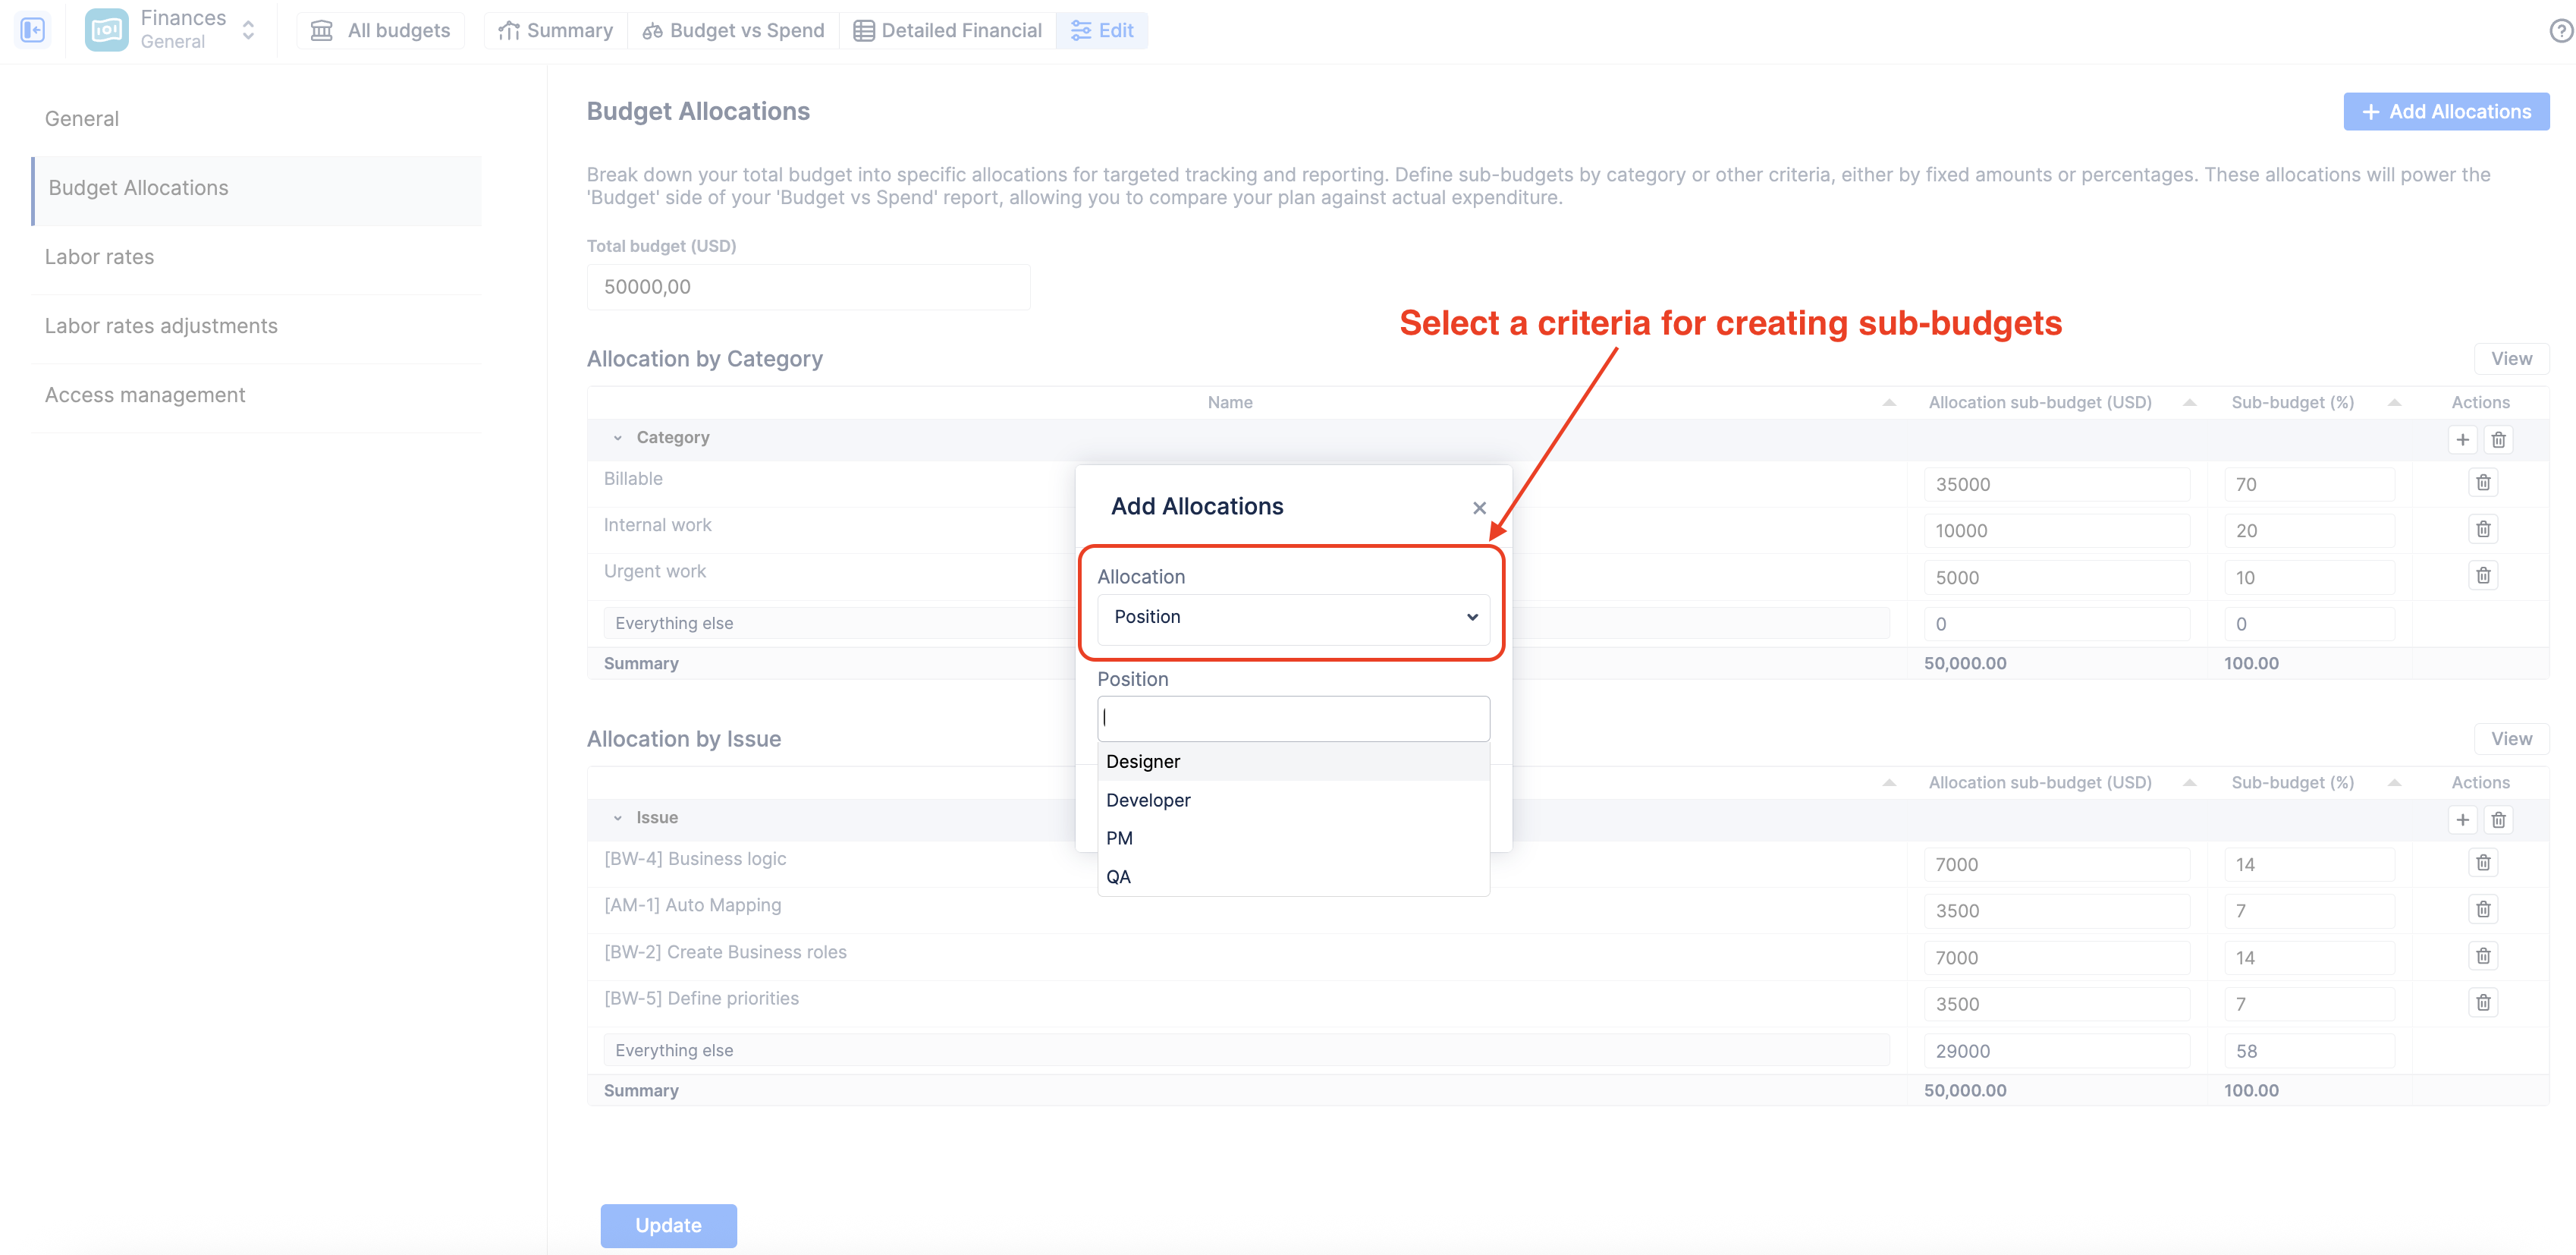
Click the blue + Add Allocations button in the top right corner.
-
A pop-up will appear asking you to choose an Allocation dimension (the "Group by" field). Select the criteria you want to use for your targets (e.g., Category, Component, Project, or Assignee).
-
Click Create.
Defining Sub-Budgets (Targets)
Once you have added an allocation dimension (e.g., "Category"), you must define the specific targets within it.
-
Click the + icon on the right side of the newly added dimension row to add a specific item (e.g., if your dimension is "Category," add "Billable").
-
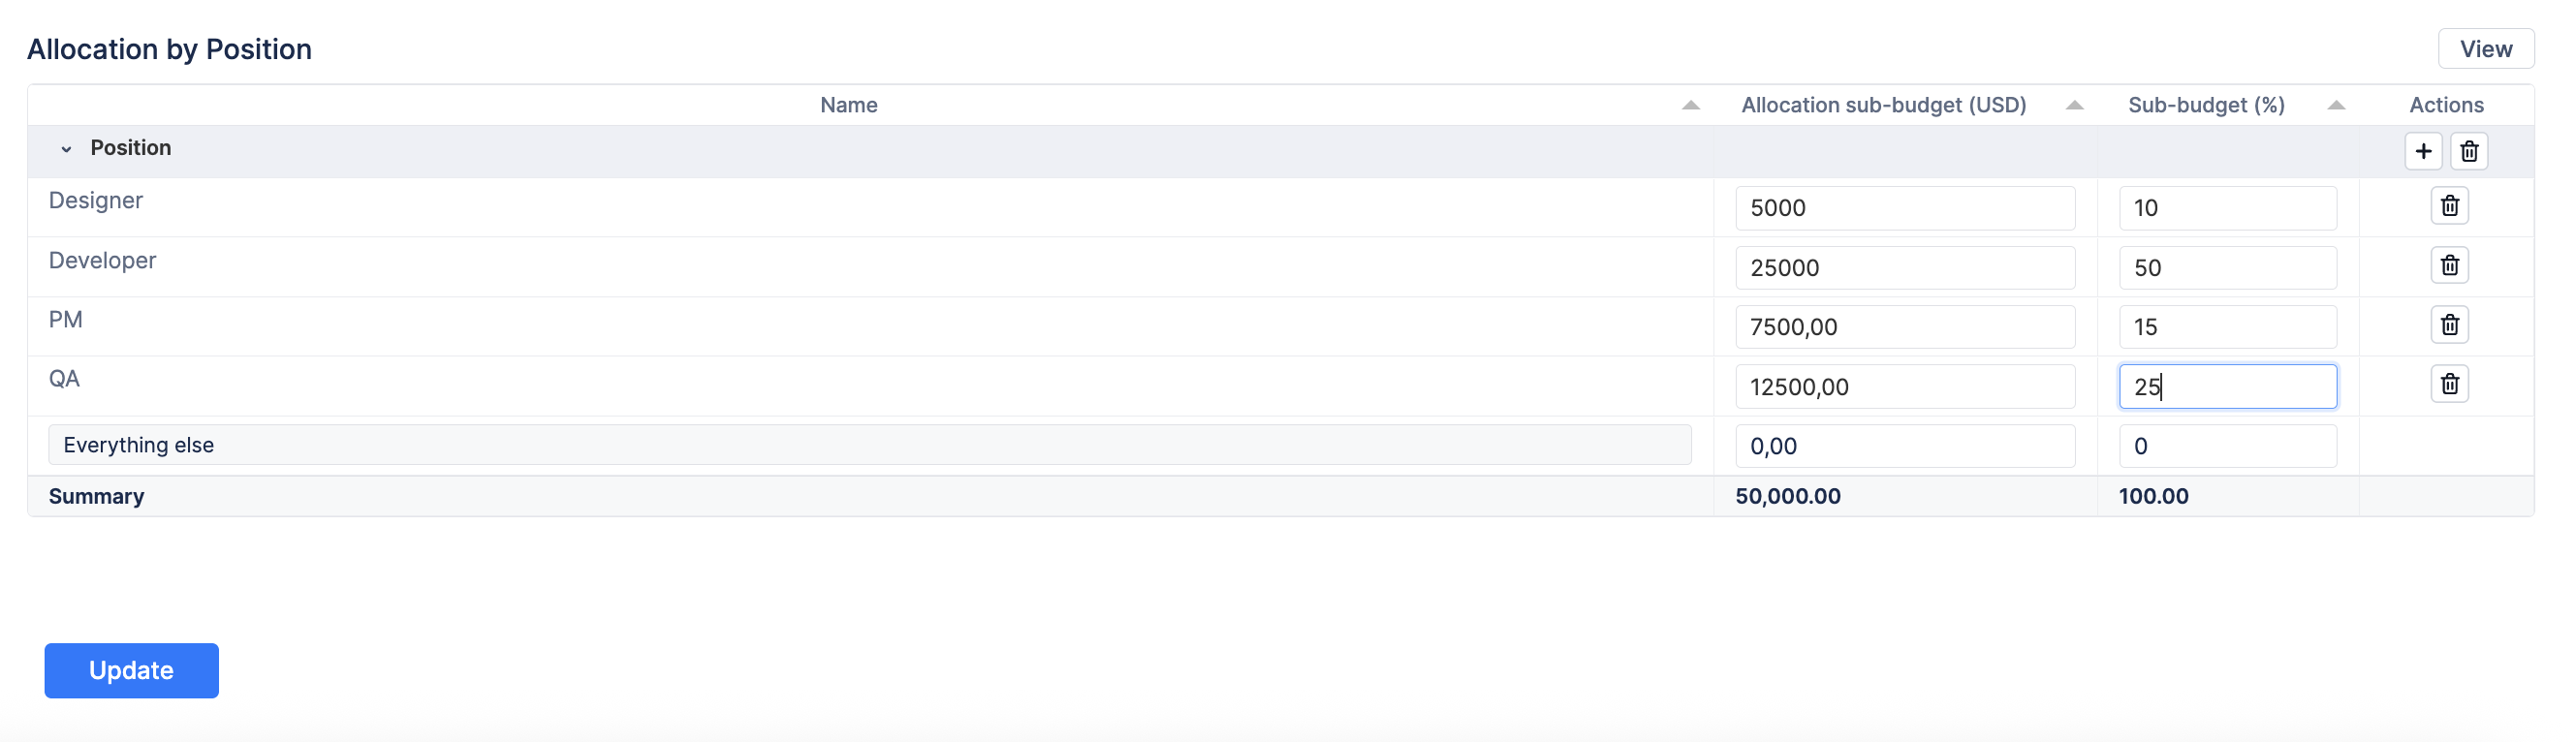
For each item, you can define the target using either a fixed monetary amount or a percentage:
-
Dimension Sub-Budget ($): Enter the exact dollar amount you plan to spend on this item.
-
Sub-Budget (%): Enter the percentage of your Total Budget you plan to allocate to this item.
-
-
Automatic Calculation: When you enter a value in one field, the system automatically calculates and fills in the other based on your Total Budget.
-
Ensure that the Summary row at the bottom adds up to 100% of your Total Budget to avoid unallocated funds.
-
Click Update to save your allocations.
💡 Note: You can create multiple allocation breakdowns for the same budget (e.g., one breakdown by Category and another breakdown by Component). You can then switch between these views in the "Budget vs Spend" report.
How Allocations Impact Reporting
It is crucial to understand that the allocations you set here dictate what you see in the Budget vs Spend report.
Understanding this report:
-
Budget (Left Chart): Displays the manual targets you defined in this configuration screen. If you select a "Group by" dimension in the report that you have not configured here, the chart will display a "No Allocations Set" warning.
-
Spend (Right Chart): Calculates automatically based on your team's actual worklogs and logged expenses.
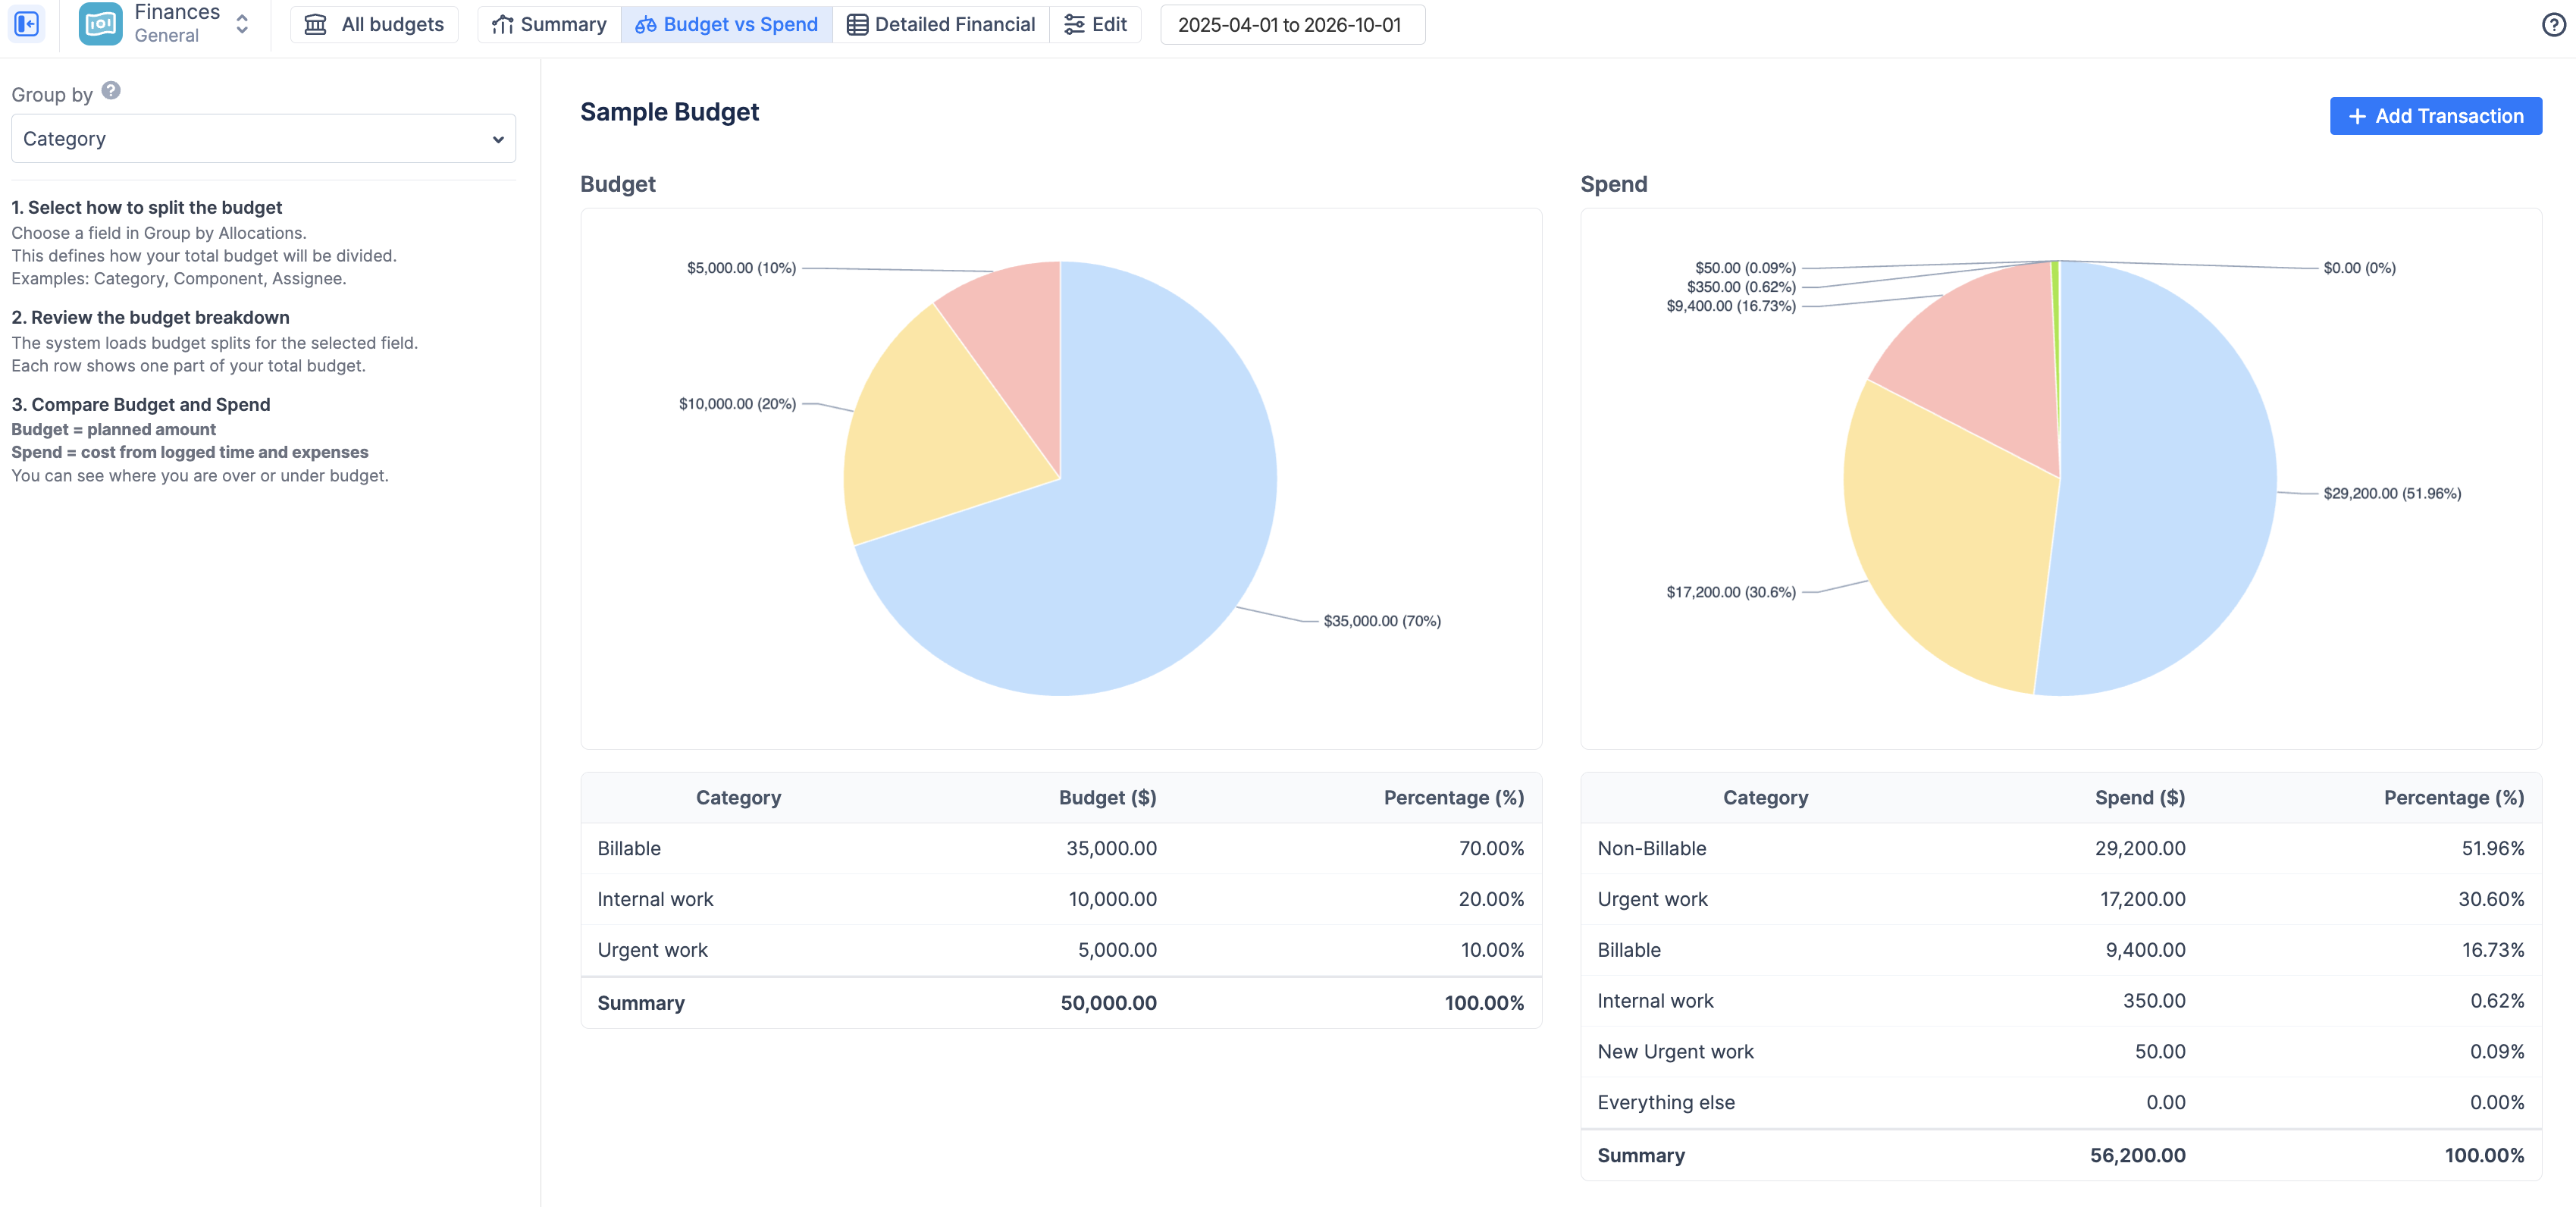
By setting accurate Budget Allocations, you enable a powerful visual comparison: “I planned to spend 70% of my budget on Billable work (Left Chart), but my team’s actual time logged shows we’ve spent only 17% of our costs on Billable work (Right Chart).”