

The Situation
A team plans work based on Jira estimates, but the actual execution may differ.
Some tasks require more effort than expected. Others finish early, remain incomplete, or consume time that was not included in the original plan.
Without comparing estimates, scheduled workload, and logged time, managers cannot easily tell whether the difference came from inaccurate estimation, changing scope, incomplete time tracking, or unexpected work.
The Primary Goal
Compare planned work with actual time spent, identify meaningful deviations, and use the results to improve future estimates and resource plans.
What You’ll Use
|
Feature |
Purpose |
|---|---|
|
Compare planned and logged hours directly in Planner |
|
|
Verify the actual time recorded by users |
|
|
Analyze estimate accuracy by issue, project, Epic, sprint, or another field |
|
|
Compare team capacity, scheduled workload, and logged time over time |
|
|
Reuse the same comparison during regular reviews |
Before You Begin
Make sure that:
-
Jira issues have accurate Original and Remaining Estimates;
-
issues are assigned and scheduled for the correct dates;
-
users log time consistently in Jira or ActivityTimeline;
-
workload and holiday schemes reflect users’ actual capacity;
-
worklogs, vacations, and other relevant activities are synchronized;
-
the selected reporting period covers both the planned work and its execution.
If your team logs time, enable the corresponding time-tracking mode under Configuration → General → Time tracking → Users log worked time. In this mode, past workload is represented by worklogs, while estimates are used to calculate current and future workload.
Learn more: Time Tracking Modes and Workload
Step 1: Check Planned and Logged Time in Planner
Open ActivityTimeline → Planner and select the required team, users, and period.
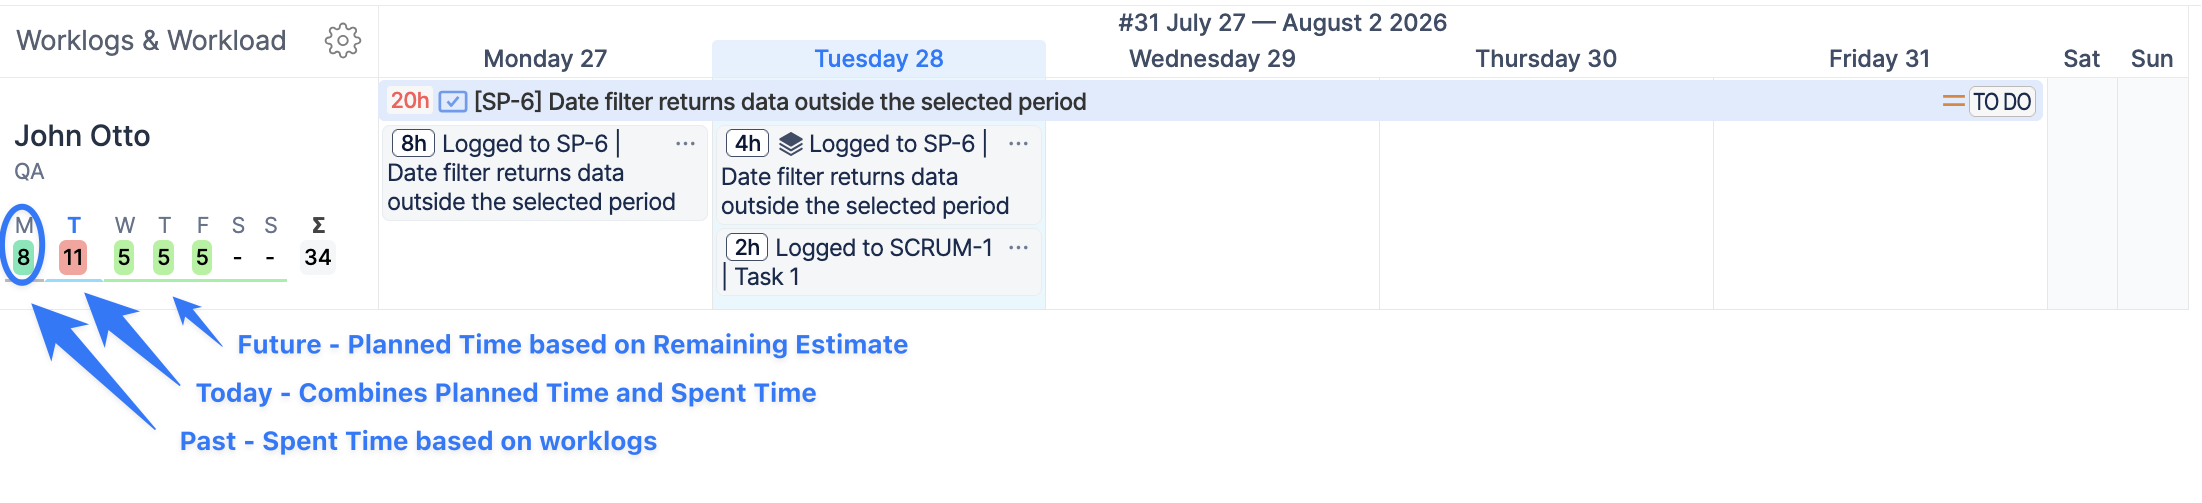
Open the workload indicator settings and choose Worklogs and Workload.
This indicator displays:
-
logged time for completed days;
-
planned workload for current and future dates;
Learn more: Individual Indicator Modes
Step 2: Verify the Actual Time Data
Before evaluating performance or estimation quality, confirm that the worklogs are complete.
Open ActivityTimeline → Track and use:
-
Timeline Timesheets to identify users or days with missing hours;
-
Detailed Timesheets to review time by project, Epic, issue, user, or another available field.
Check for:
-
days with insufficient logged time;
-
worklogs assigned to the wrong issue or project;
-
work completed without a corresponding worklog;
-
unusually high entries that may need clarification.
A deviation is meaningful only when the underlying time records are complete and accurate.
Learn more:
Step 3: Analyze Estimation Accuracy
Open Reports → Planned vs Actual Report.
Configure the report:
-
Period: select the sprint, month, quarter, or custom period;
-
Teams / People: choose the required team or users;
-
Report By: select issues, a project, an Epic, or a Jira filter;
-
Group By: choose Sprint, Project, Epic, Issue Type, or another relevant field;
-
Acceptable Deviation: define how much variation should still be considered normal.
The report compares:
-
Original Estimate: the initially expected effort;
-
Time Spent: the time already logged;
-
Remaining Estimate: the effort still expected;
-
Deviation: the difference between the original estimate and the latest expected total.
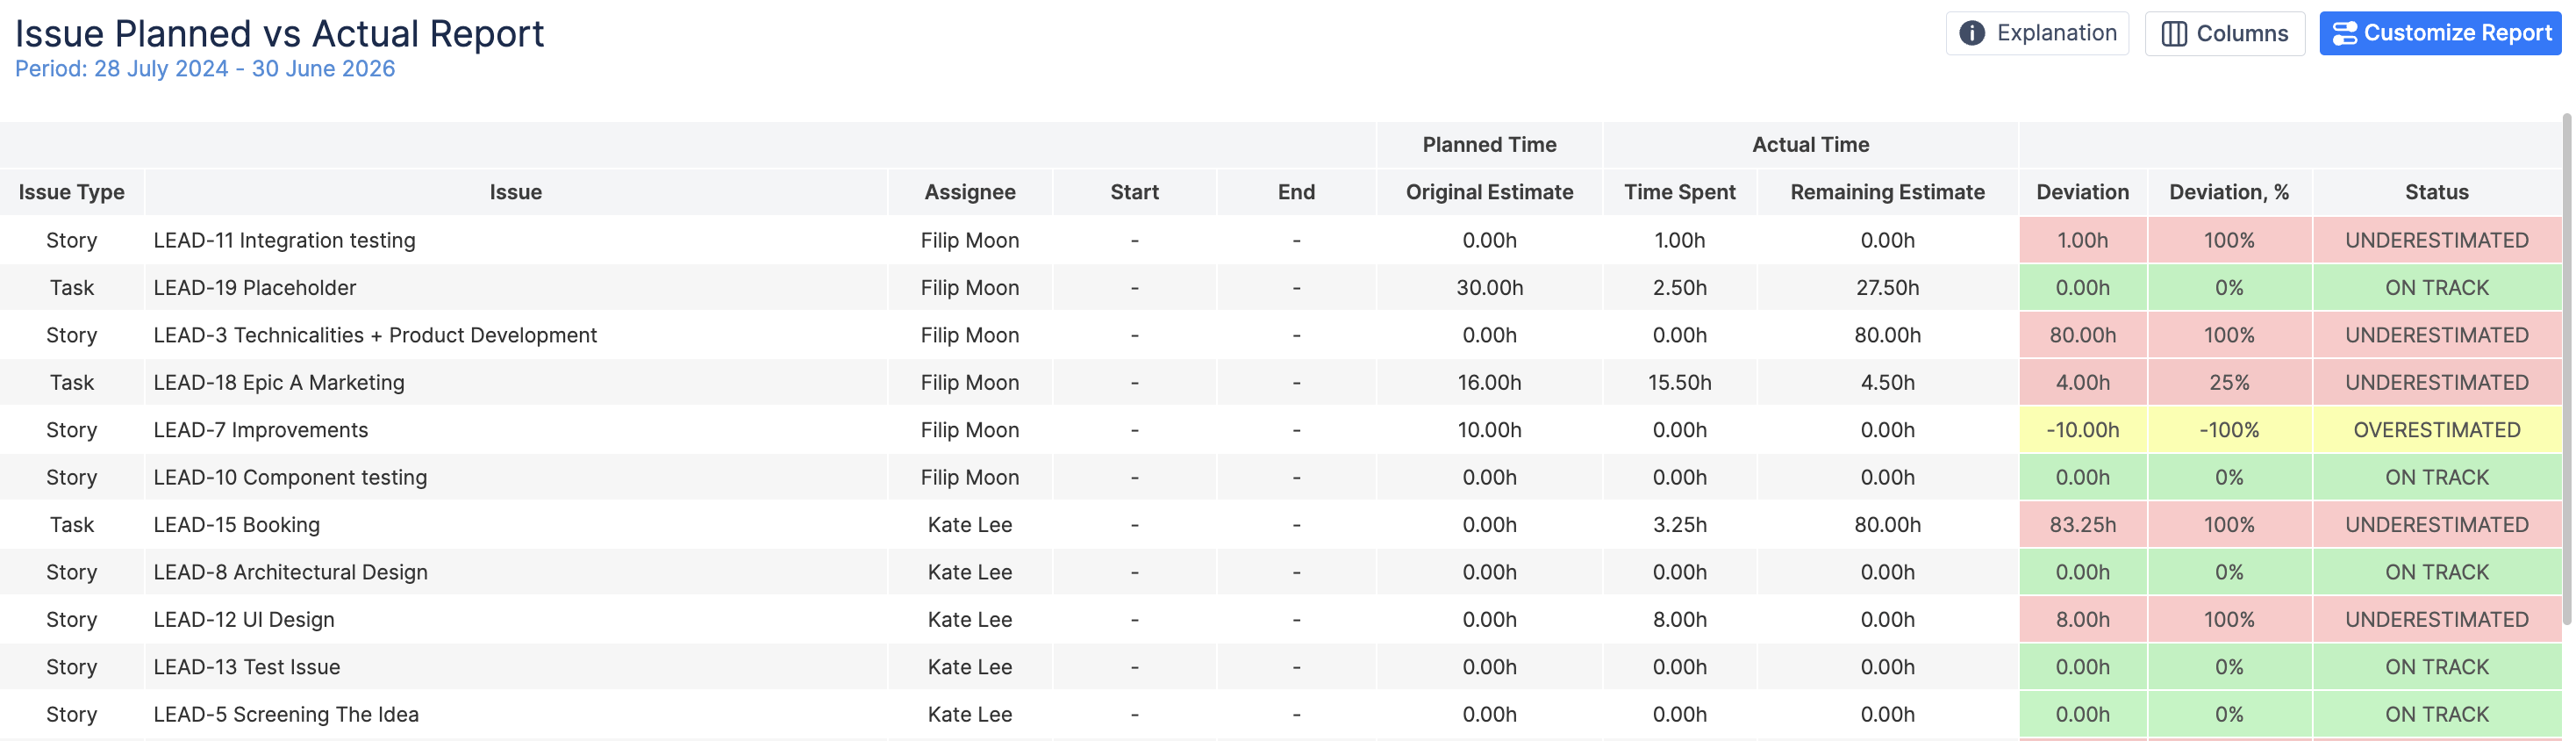
ActivityTimeline classifies the result as:
-
On Track: actual and remaining effort are within the acceptable deviation;
-
Underestimated: more effort is required than originally estimated;
-
Overestimated: less effort is required than originally estimated.
When parent issues contain subtasks, decide whether their estimates and worklogs should be aggregated into the parent. Use the same setting in recurring reports so that comparisons remain consistent.
Learn more: Planned vs Actual Report
Step 4: Compare Capacity, Scheduled Work, and Delivery
Use the Planned vs Actual Chart when you need a higher-level trend rather than an issue-by-issue analysis.
Configure the chart by Team, Project, Epic, or Jira Filter and choose a weekly or monthly display.
When reporting by Team, the chart compares:
-
Team Capacity: the team’s available working capacity;
-
Scheduled Time: Original Estimates of scheduled Jira issues, Bookings, and Placeholders;
-
Logged Time: work actually recorded through Jira or ActivityTimeline.
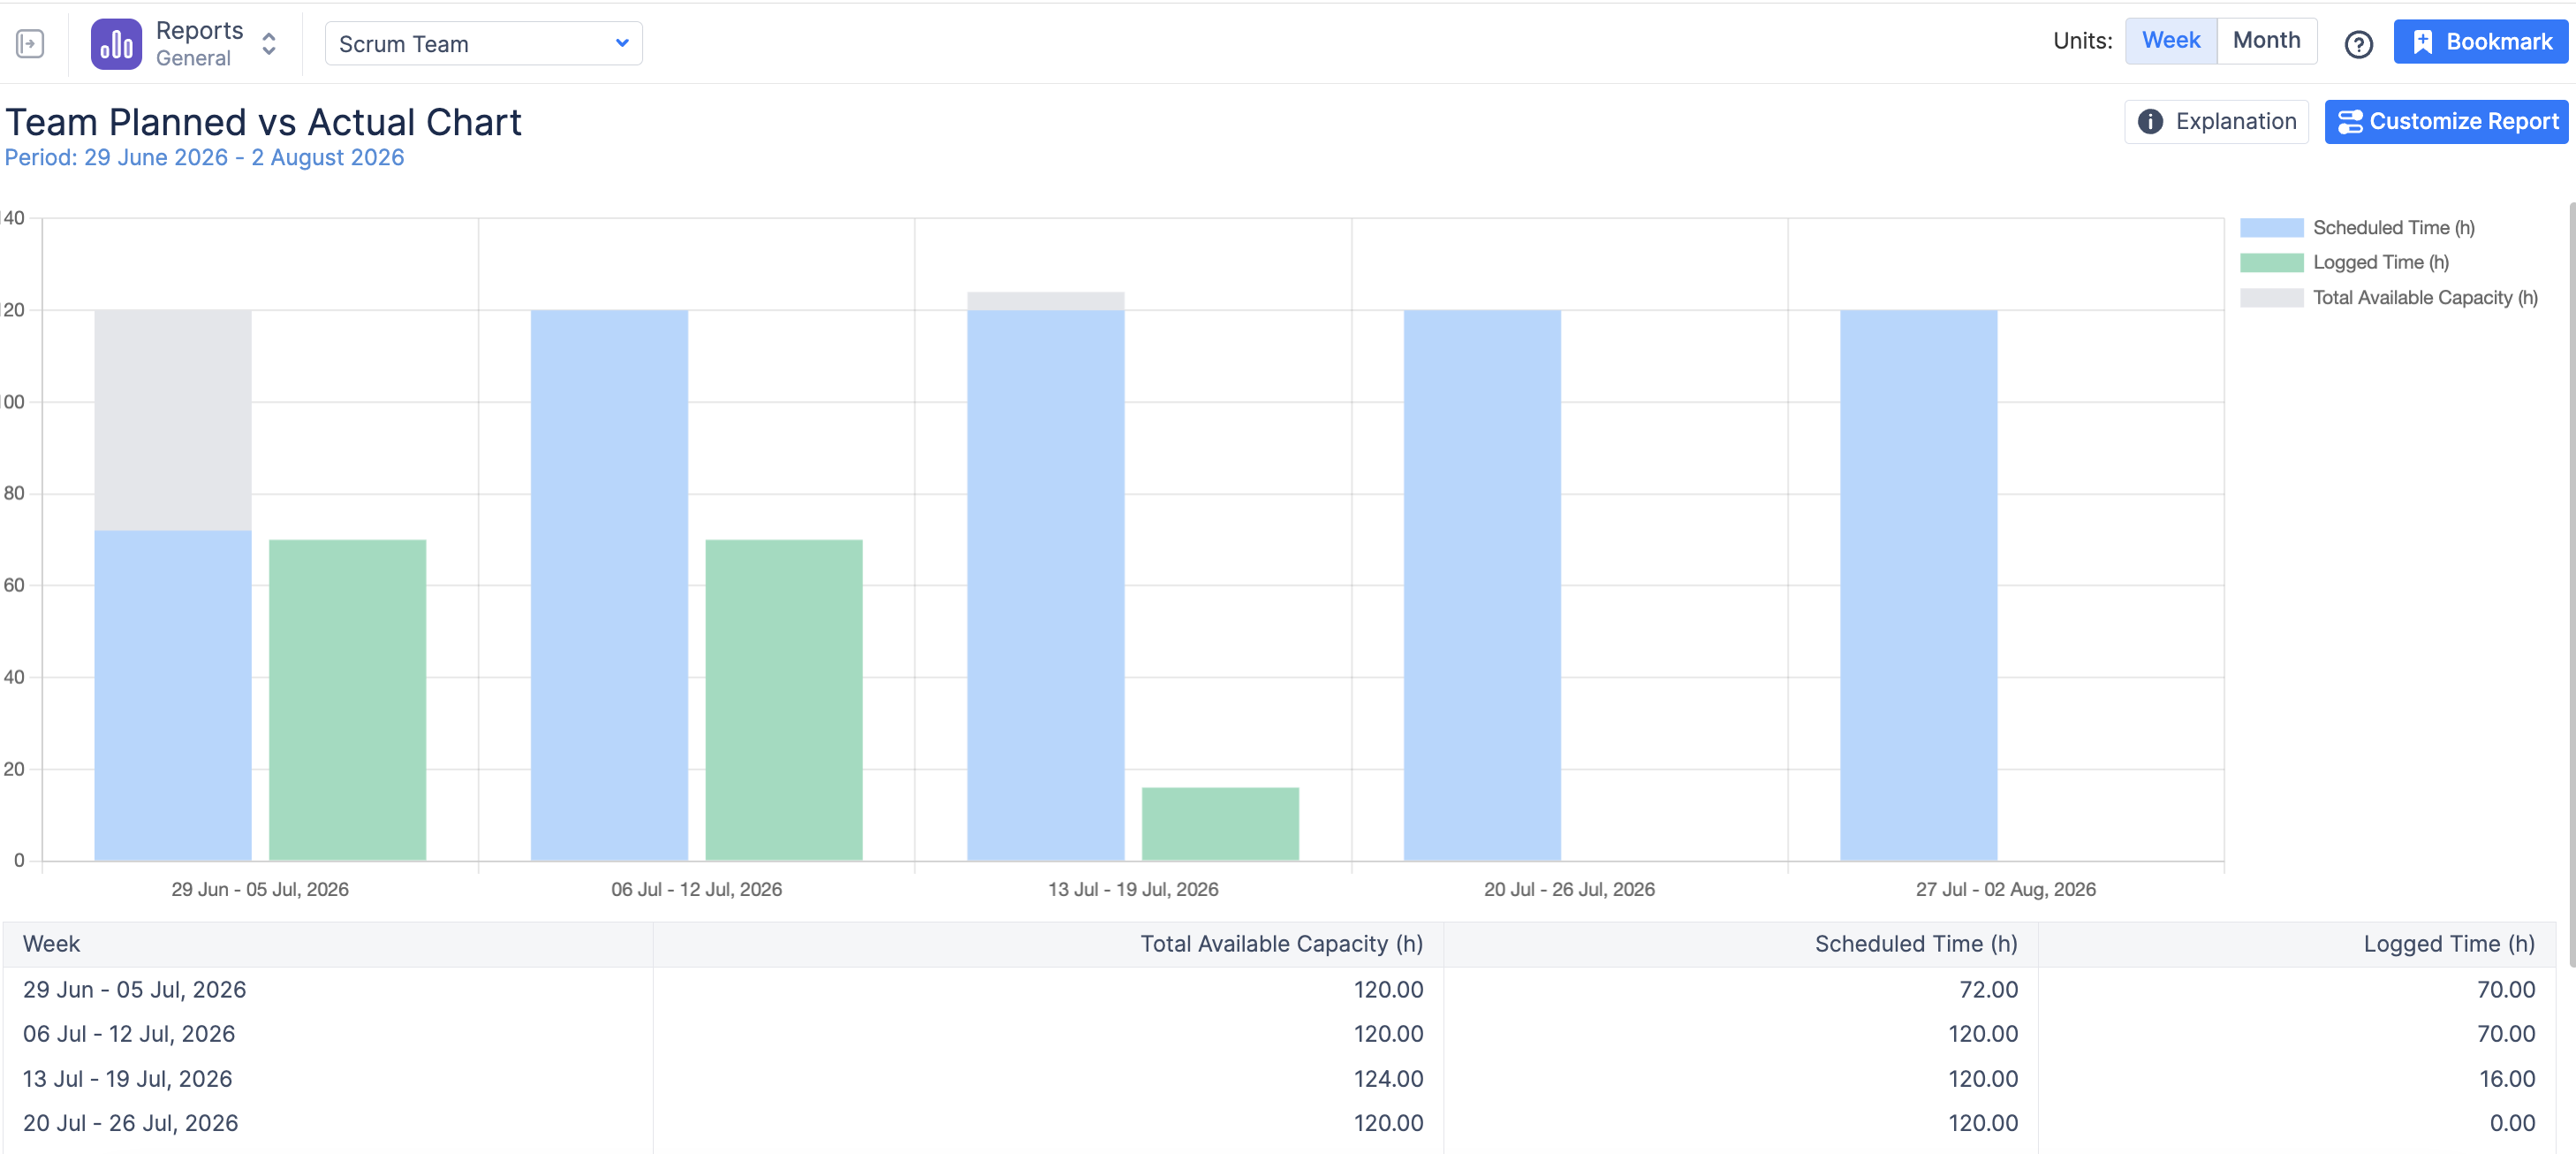
This helps answer:
-
Did the team schedule more work than its available capacity?
-
Was substantially more or less time logged than planned?
-
Is the difference isolated to one period or repeated over time?
-
Are planning and delivery becoming more predictable?
Learn more: Planned vs Actual Chart
Step 5: Investigate Important Deviations
When you identify a significant difference, review the related issues and determine its likely cause.
Common causes include:
-
the original estimate was too low or too high;
-
requirements or scope changed after planning;
-
unexpected support or operational work appeared;
-
time was logged against a different issue or project;
-
the Remaining Estimate was not updated;
-
work was rescheduled or left incomplete;
-
the team’s actual availability differed from the original plan.
Avoid treating every deviation as a performance problem. Planned-versus-actual data is most useful for improving the planning process and identifying recurring patterns.
Step 6: Apply the Findings to Future Planning
Use the results during sprint reviews, monthly resource meetings, or quarterly planning.
Depending on what you find, you can:
-
adjust estimates for similar future tasks;
-
update Remaining Estimates for ongoing work;
-
include recurring unplanned activities in capacity plans;
-
reserve contingency capacity for support or urgent requests;
-
rebalance work between users or teams;
-
revise the next sprint or forecast before new work is committed.
Save or bookmark the report when the same filters and grouping will be used regularly.
Expected Result
After completing this workflow, you will have:
-
verified and complete actual-time data;
-
visibility into differences between estimates, scheduled workload, and logged time;
-
underestimated and overestimated work identified;
-
recurring planning or time-tracking problems separated from isolated exceptions;
-
evidence that can improve future estimates, sprint commitments, and capacity forecasts.